11.2.5. Basic power profiler operations
Burn application to flash using the Flash Code or Flash Data tool and start it by pressing the hardware reset button. Alternatively download a firmware to the ram memory using the RAM tool.
From Monitor menu select the Power Profiler tool. A new menu called “Power Profiler” appears presenting tool options
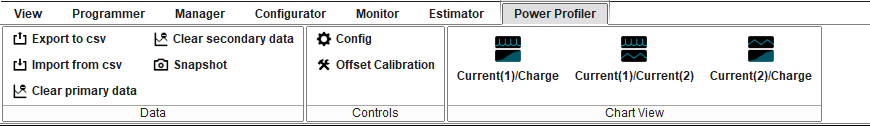
Figure 213 Power Profiler ribbon menu
From Board menu select the Power Profiler port (Figure 200)
Press the Initialize button. A warning may appear that the EEPROM memory cannot be read and that power measurement module v. 2.0 cannot be detected. This warning is expected for the chips having power measurement module v. 1.0. The Start button is enabled.
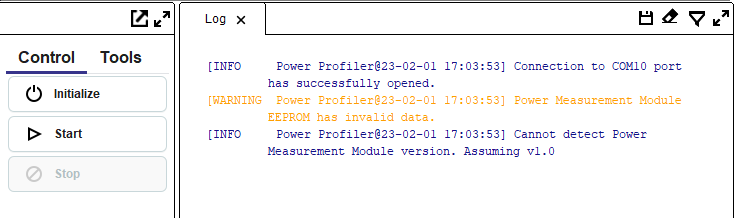
Figure 214 Log messages after initialize process
Press the Start button and then Stop when ready. Move mouse scroll wheel to zoom in and out on the graph. Right click on the graph to show time on X axis.
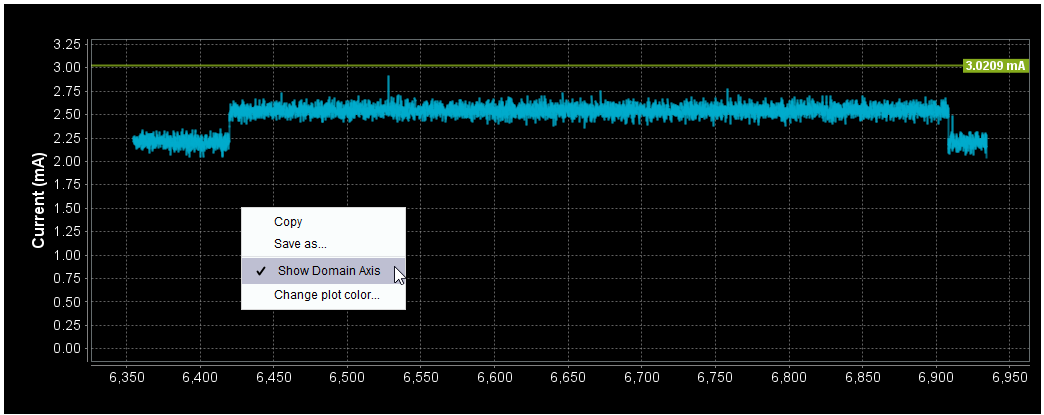
Figure 215 Log messages after initialize process
From Tools tab select Measure to measure a part of the graph (red lines) or Add Time Marker to place a time marker (green line)
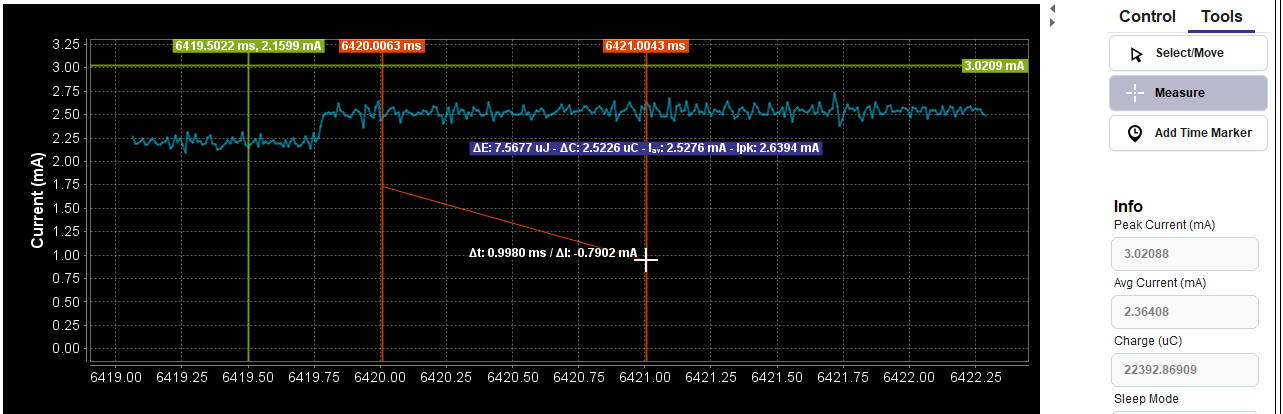
Figure 216 Power Profiler tools tab
For full documentation of the Power Profiler tool refer to Power Profiler