5. Debug the proximity reporter Project
Inside the SDK package, you’ll discover e2 studio launch configurations for all DA1453x and DA1458x targets within the config folder. These launch configurations are prefixed with es2_ and can be imported into e2 studio using a process similar to importing a project (import Run/Debug configurations).
Utilize these launch configurations to debug each target effectively. make sure that the target board is connected to the computer.

Figure 11 DA1453x DEVKIT-P connections
Select the debugger for your project by clicking
Debugger Configurations…
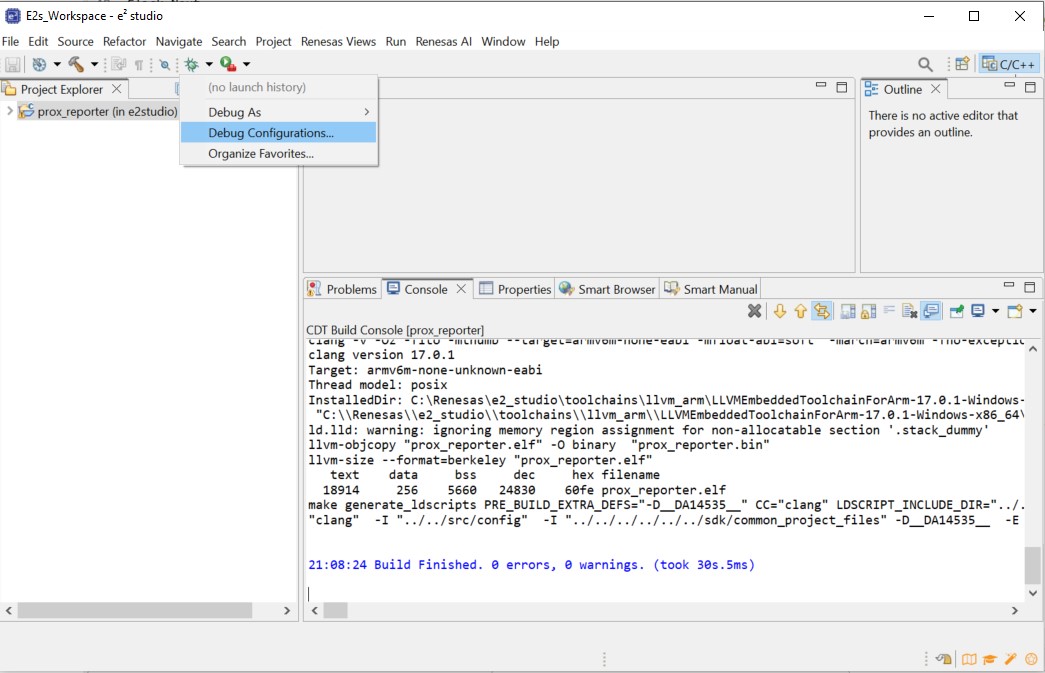
Figure 12 e² studio Debugger Configurations selection
In
Debug configurationwindow selectRenesas GDB Hardware Debuggingthen click on existing debug configurationprox_reporter_Debug_RAM_DA14531
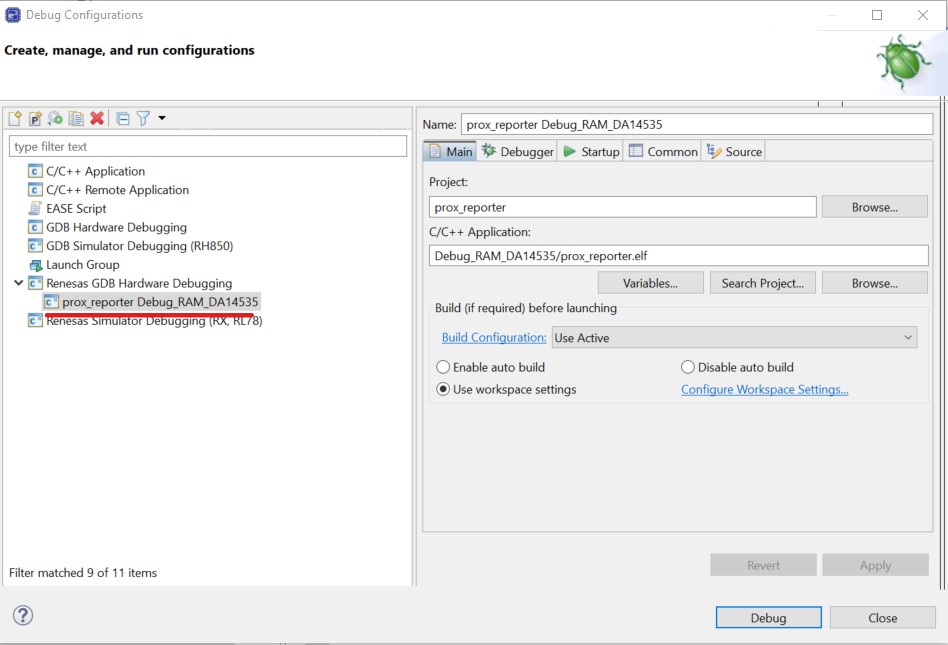
Figure 13 e² studio Debugger configuration
Press debug and then tick
remember my my decisionand click toswitch

Figure 14 Confirm Perspective Switch
In debug mode, e2 studio executes the following tasks:
Downloading the application image to the target device (DA1453x) and programming the image to the internal System RAM.
Displaying the startup code where the program counter points to.
While in Debug mode, click Run > Resume or click on the Play icon twice to continue.
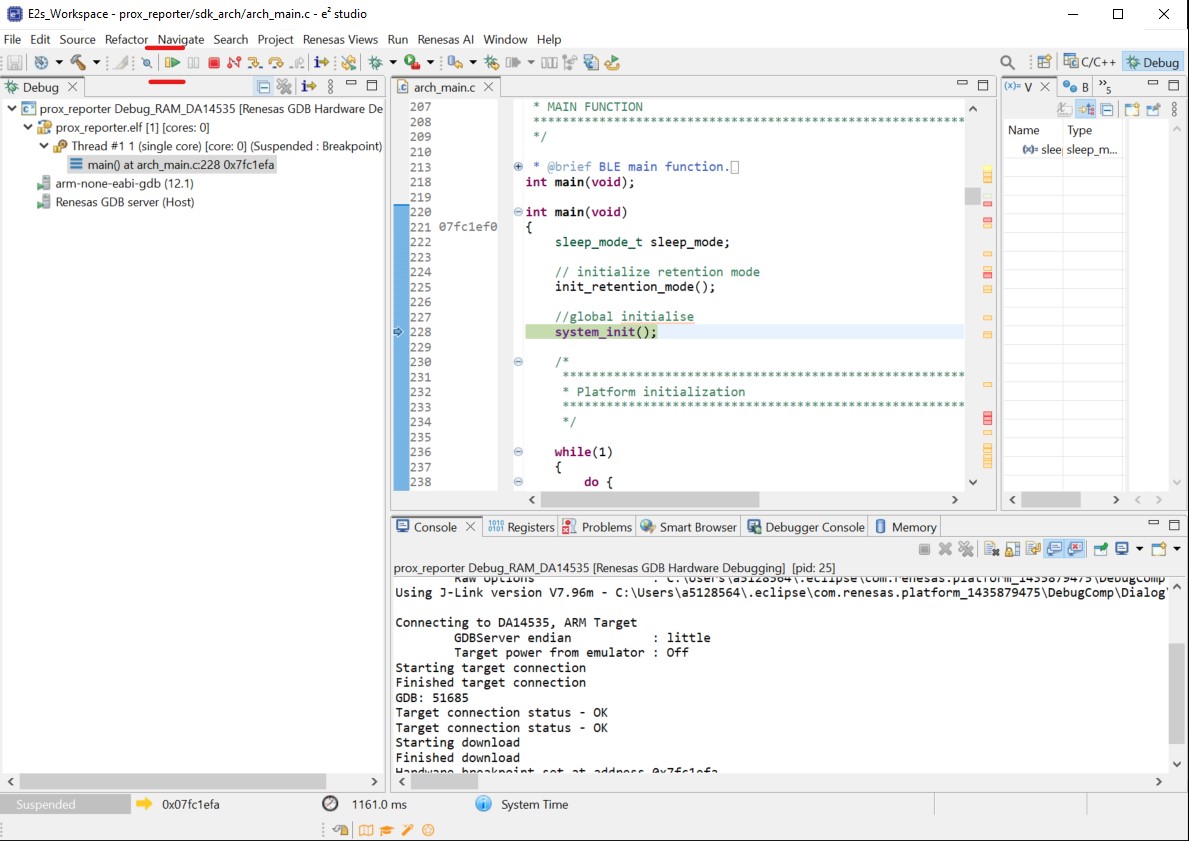
Figure 15 e² studio Debugger Play icon
The program status changes to
Running
Figure 16 e² studio Debug running
Use the SmartBond app to scan for, and connect to the DLG-PROXR
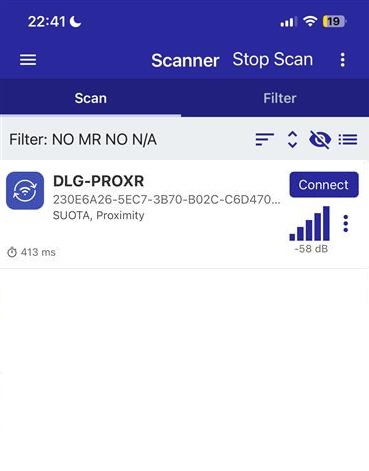
Figure 17 Using the SmartBond app to connect to the BLE application
Your BLE application is now running and advertising with the default advertiser string: DLG-PROXR
Note
You can refer to this video which demonstrates how to build and debug for SmartBond™ device running SDK6 in e² studio.