30. Appendices

30.1. Eclipse and GCC

In addition to the Keil toolchain, SDK6 also supports the use of GCC in conjunction with the Eclipse IDE.

The SmartSnippets™ Studio development platform contains the Eclipse CDT IDE and GCC toolchain, and should be installed before proceeding:

30.1.1. Using the Eclipse IDE and GCC Toolchain

The SDK6 contains a sample application which has an Eclipse project file, allowing it to be built using the GCC toolchain.

This project can be found in the following folder:

<sdk_root_directory>/projects/target_apps/ble_examples/prox_reporter/Eclipse

The instructions below describe how to build and run this sample application using the Eclipse IDE and GCC toolchain.

30.1.1.1. Building the Example

  1. Start SmartSnippets Studio, and when prompted set the workspace location to be the sdk root directory, then press “Launch”.

_images/eclipse-workspace.PNG

Figure 103 Select the Eclipse Workspace

  1. Start the Eclipse IDE by clicking on the icon highlighted in the diagram below.

_images/eclipse-ide.png

Figure 104 Start the Eclipse IDE

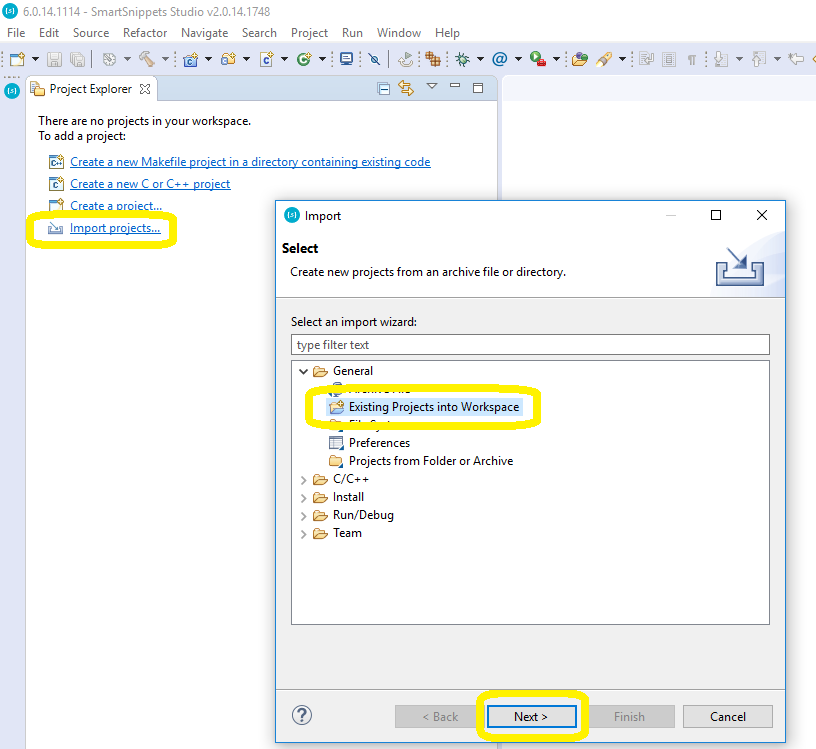
  1. Now import the prox_reporter project. To do this, click on the Import Projects link in the Project Explorer window, select the Existing Projects into Workspace option, and then press Next.

_images/eclipse-import1.PNG

Figure 105 Import the Project

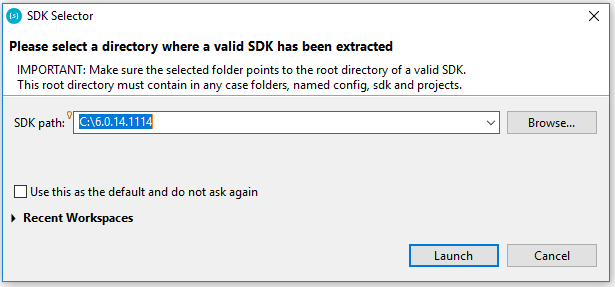
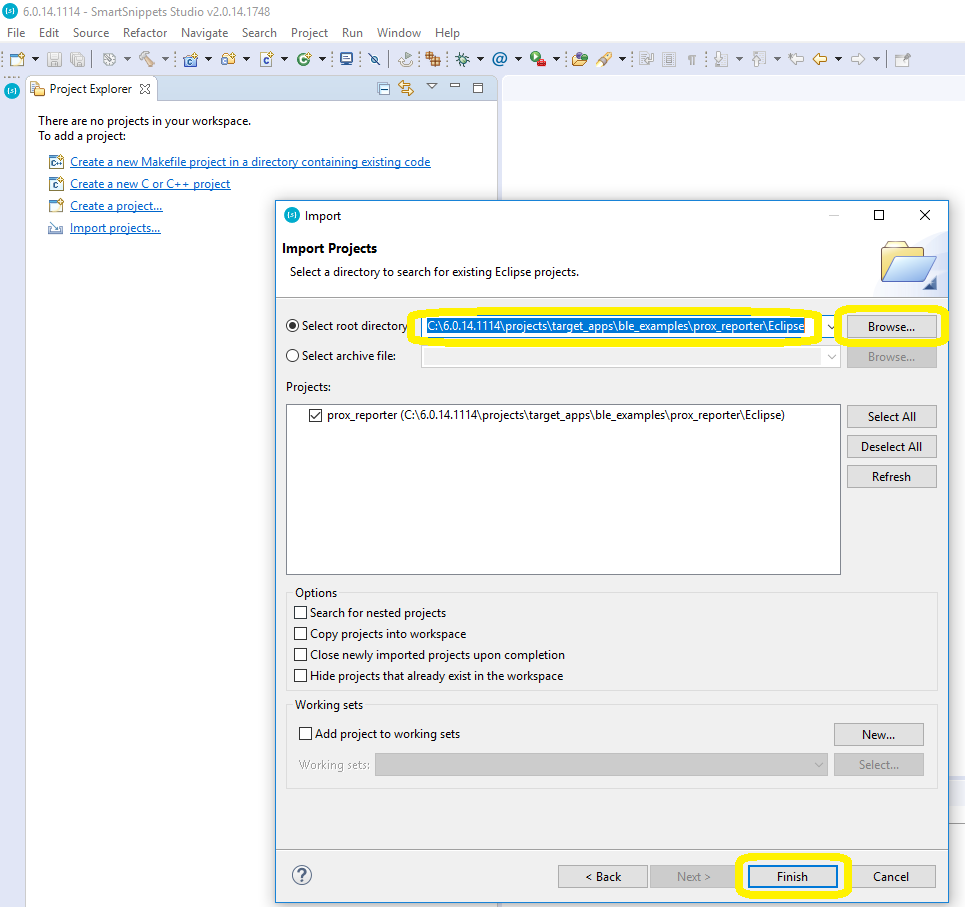
  1. Next, use the Browse button to navigate to the sdk_root_directory>/projects/target_apps/ble_examples/prox_reporter/Eclipse . Finally, press the Finish button to import the project into the Eclipse IDE.

_images/eclipse-import2.PNG

Figure 106 Select the Project

  1. To build the prox_reporter project, click on the arrow next to the build icon and select the appropriate target (DA1453x, DA14585 or DA14586).

_images/eclipse-build1.png

Figure 107 Building the Project

  1. Once the build is complete the following output will be displayed in the console window.

_images/eclipse-build2.png

Figure 108 Build Output

30.1.1.2. Debugging the Example

Once the build is complete the sample application can be loaded into RAM, and executed under the control of the debugger, as follows:

  1. To start the debugger, click on the arrow next to the debugger icon and select appropriate target.

_images/eclipse-debug1.png

Figure 109 Start the Debugger

  1. If you get the following error message, jump to step 5, otherwise continue to step 3.

_images/eclipse-debug2.PNG

Figure 110 Debugger Error Message

  1. When prompted, switch to the Debug perspective by pressing the Switch button.

_images/eclipse-debug5.PNG

Figure 111 Switch Perspective

  1. Finally, start execution of the prox_reporter sample application by pressing the Resume button.

_images/eclipse-debug6.png

Figure 112 Start Application Execution

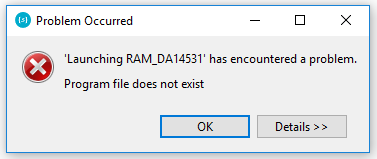
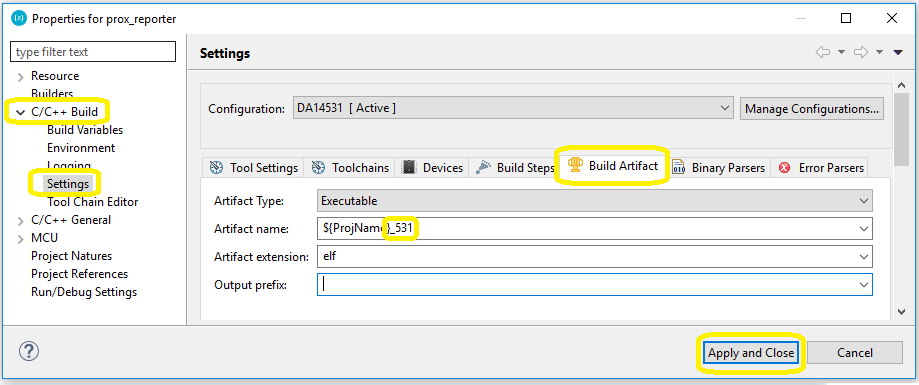
  1. In some versions of SDK6 there is an error with prox_reporter project configuration. The debugger is expecting a file named prox_reporter.elf, however the output of the build is a file containing the target within the name i.e. prox_reporter_531.elf. To resolve this issue we must change the build output to match the debugger configuration. To do this, right click on the prox_reporter folder in the Project Explorer window and select Properties.

_images/eclipse-debug3.png

Figure 113 Project Properties

  1. Next, expand the C/C++ Build tab and select the Settings option. Select the Build Aritfact tab and remove the target extension from Artifact name, in this case we are removing the _531 extension. Press the Apply and Close button to apply the changes, rebuild the example and then restart the debugger as described in step 1.

_images/eclipse-debug4.PNG

Figure 114 Build Output Modification