2. Debugging
A debugging session lets you control the execution of a program by setting breakpoints, suspending executed programs, stepping through the code, and examining the contents of variables and structures. This section demonstrates the most useful tools and features of the Eclipse IDE that can be used during debugging.
2.1. Initiating a Debugging Session
To initiate a debugging session, a debugger must be attached to the SWD or JTAG port of the application MCU. The DA1468x Pro DevKit has a debugger mounted on it, thus eliminating the need for an external one which can be quite an expensive tool.
There are two ways to start a debugging session, the selected method depends on the issue being examined.
One option is for the developer to start inspecting program execution from the beginning by triggering a
hardware reset while attaching the debugger to the MCU. This means that the program is executed from its
very first step and by default the first breakpoint is set to the main function of the application.
The second option is for the debugger to be attached without triggering any reset to the system.
- Click on the Debug button (1) and select either ATTACH or QSPI (2). Selecting QSPI triggers a hardware reset to the system while the debugger is being attached.

Fig. 1 Initiating a Debugging Session
- Depending on the configuration, a pop-up window might be displayed asking for permission to switch to the Debug view.
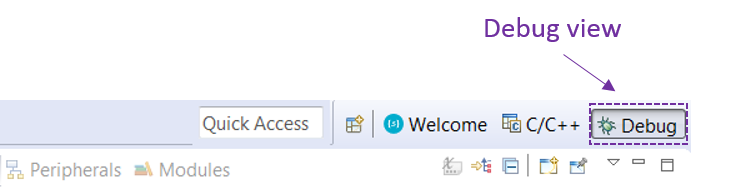
Fig. 2 Debug View
- When switching to the Debug view, either the code execution is automatically halted on a breakpoint, or the developer should pause the execution of the application by clicking on the Suspend button.

Fig. 3 Resume, Suspend, and Terminate a Debug Session
2.2. Changing the Default Breakpoint
By default, a breakpoint is set on the main function of the application. However,
things may go wrong before the code even gets to the main function.
In this case, operation should be halted earlier, for instance in the reset handler. To do so, the following
steps should be executed:
- Click on the Debug button and select Debug Configurations….
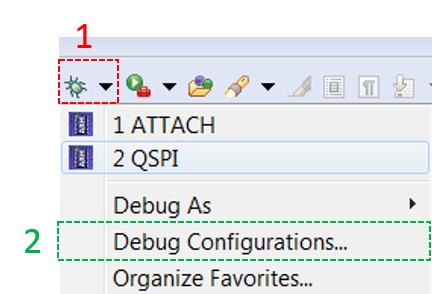
Fig. 4 Changing the Default Breakpoint #1
The Debug Configurations window is displayed.
- In the Debug Configurations window, select SmartBond SmartSnippets DA1468x via J-Link GDB Server > QSPI.
- In the Startup tab, change the default breakpoint in the Set breakpoint at field and click on Apply. In this example,
Reset_Handleris selected.
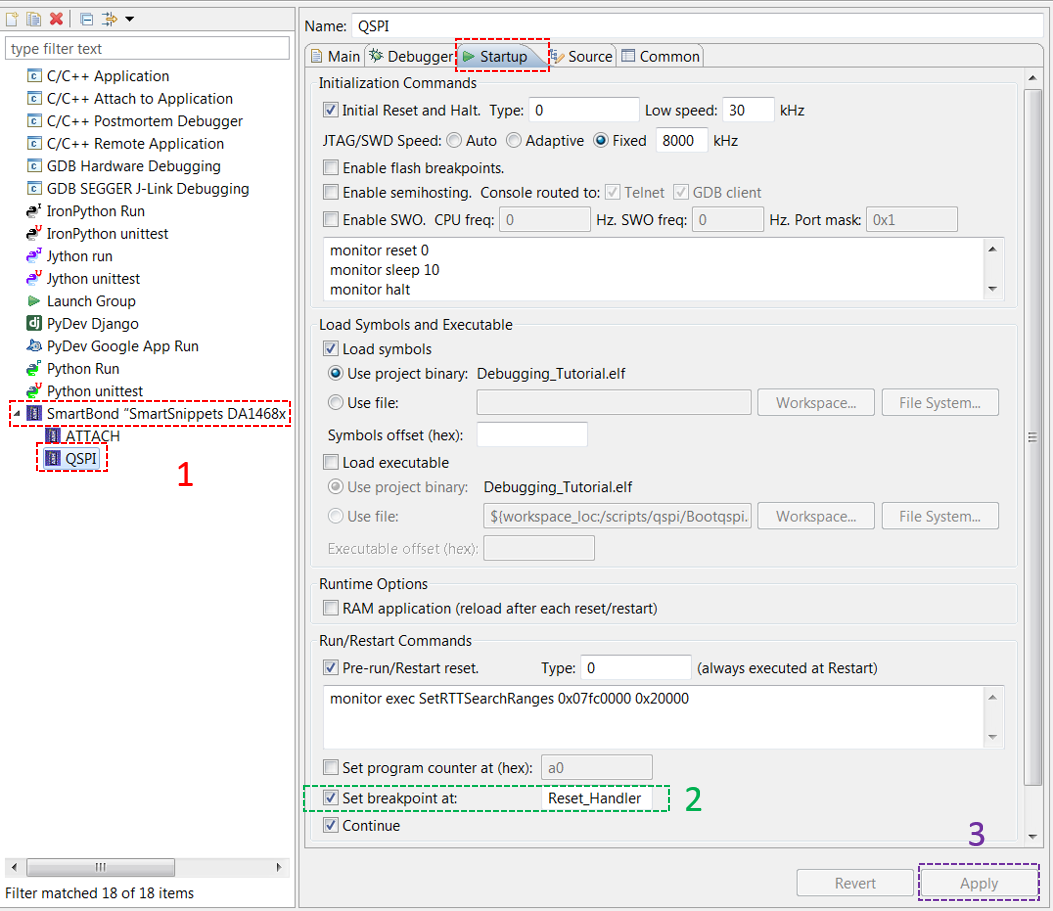
Fig. 5 Changing the Default Breakpoint #2
Note
The Cortex-M0 Breakpoint Unit (BPU) implementation provides between zero and four hardware breakpoint registers. A processor configured with zero breakpoints implements no breakpoint functionality. Typical hardware breakpoints watch an internal bus or the program counter and if it matches a certain condition it will either stop the processor or do whatever the hardware implements for that condition.
2.3. Device-Specific Registers
During a debugging session, the developer can read, as well as set, systems registers including GPIOs and other peripheral registers. This is done in the Eclipse tool named EmbSys Registers. To enable this tool, follow the steps below:
- From the Window menu, select Show View > Other…. The Show View window is displayed.
- In the Show View window, select Debug > EmbSys Registers (1) and then click OK (2).
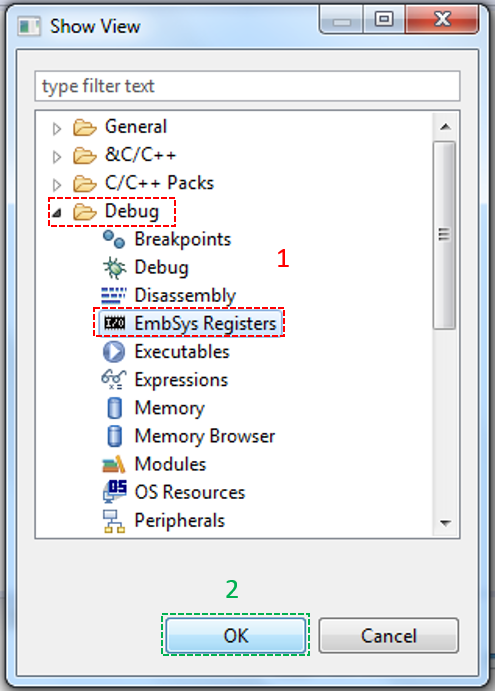
Fig. 6 Show View Window
The EmbSys Registers window is displayed.
To configure the tool, from the Window menu, select Preferences. The Preferences window is displayed.
In the Preferences window, select C/C++ > Debug > EmbSys Register View (1) and then configure the tool as required (2).
In the Chip field, select the correct family of devices (in our case DA14681-01). Finally click OK (3).
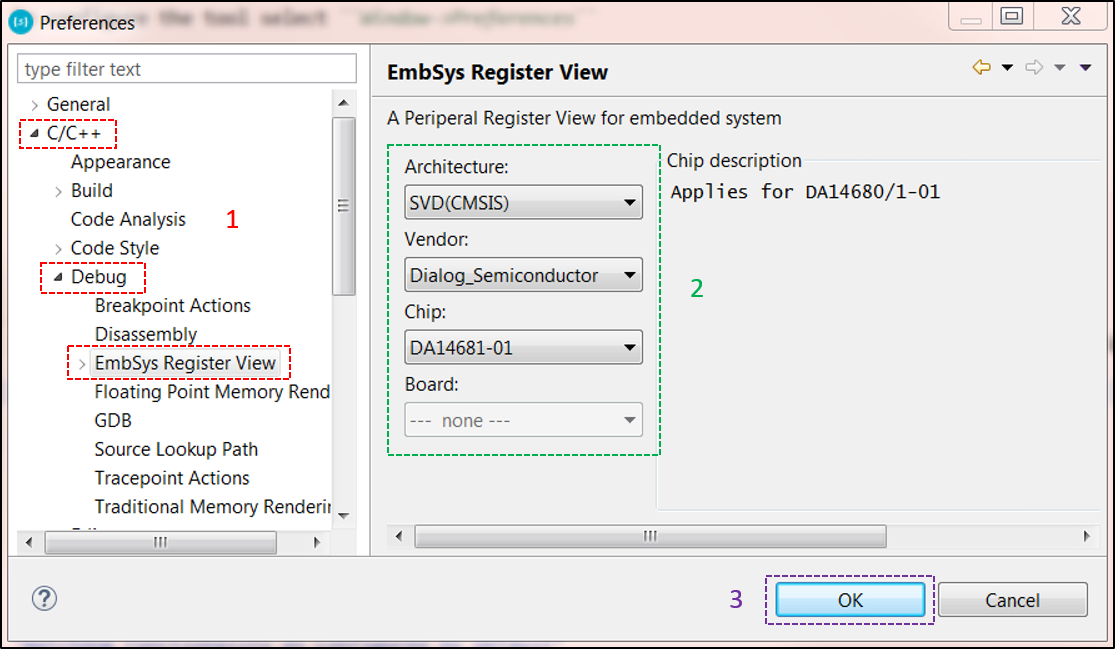
Fig. 7 Configure the EmbSys Registers Tool
- To read or modify register values, make sure the debugger is attached and suspended.
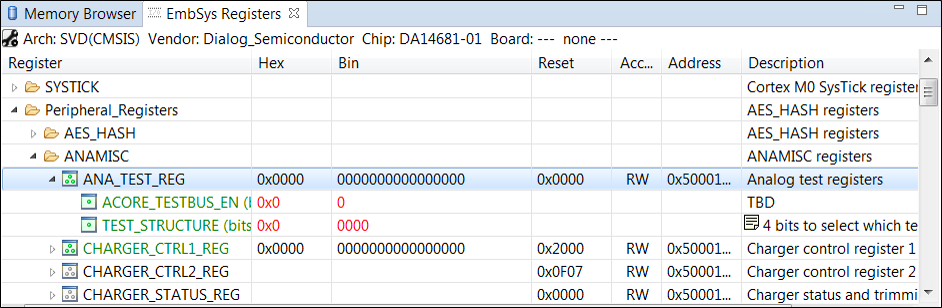
Fig. 8 The EmbSys Registers View
2.4. Useful Debug Tools
The Eclipse IDE offers a variety of debugging tools which can be used during a debugging session. The tools are available through various windows which can be enabled/disabled by selecting them from the Window > Show View menu.
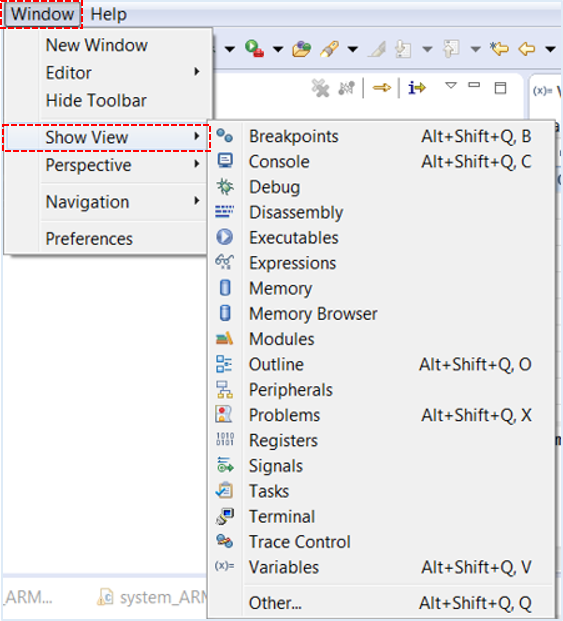
Fig. 9 Selecting a Window
- The Debug window displays the currently running task’s stack through the function call tree.

Fig. 10 Stack Frame in the Debug Window
- The Registers window (1) displays the MCU registers.
- The Variables window (2) displays local variables.
- The Expressions window (3) displays:
- variables residing in statically created variables
- variables residing in heap using the variable location address
- arrays of data and also complex structures of data
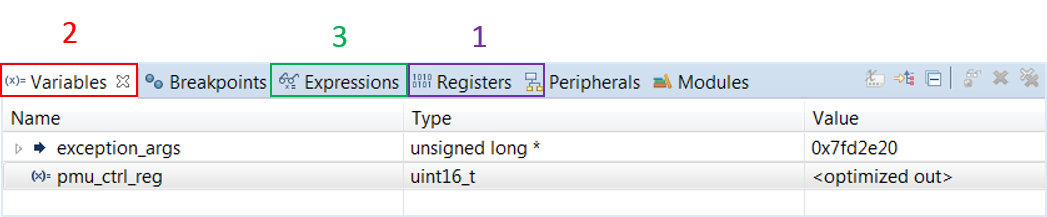
Fig. 11 Useful Debug Windows