4. Running The Demonstration Example
This section describes the steps required to prepare the Pro DevKit and other tools to successfully run the example code. A serial terminal, a 24LC256 EEPROM module, and optionally a logic analyzer are required for testing and verifying the code. In addition, two 2.4 kΩ resistors, a breadboard, and a few jumper wires are required to connect the I2C module to the Pro DevKit. If you are not familiar with the recommended process on how to clone a project or configure a serial terminal, read the Starting a Project tutorial.
There are two main methods to verify the correct behavior of the demonstrated code. The first method is to use a Serial Terminal and the second is to use a logic analyzer. Both cases are given below as a logic analyzer can be quite an expensive tool.
4.1. Verifying with a Serial Terminal
- Establish a connection between the target device and your PC through the USB2(DBG) port of the motherboard. This port is used both for powering and communicating to the DA1468x SoC. For this tutorial a Pro DevKit is used.
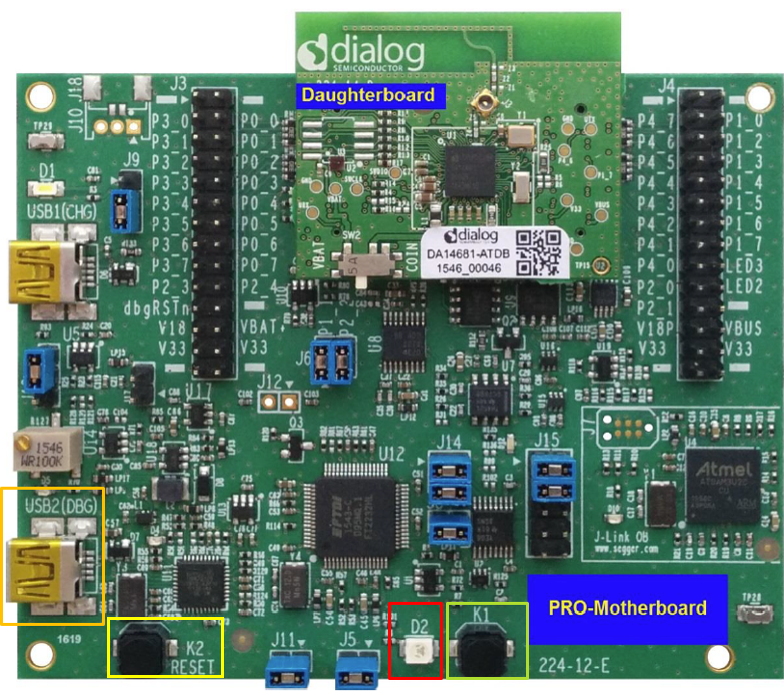
Fig. 11 DA1468x Pro DevKit
- Import and then make a copy of the freertos_retarget sample code found in the SDK of the DA1468x family of devices.
Note
It is essential to import the folder named scripts to perform various operations (including building, debugging, and downloading)
- In the newly created project, create a new
platform_devices.hheader file under the project’s/configfolder. To do this:- Right-click on the
/sdk/adapters/include/platform_devices.hheader file (1) and select Copy (2).
- Right-click on the
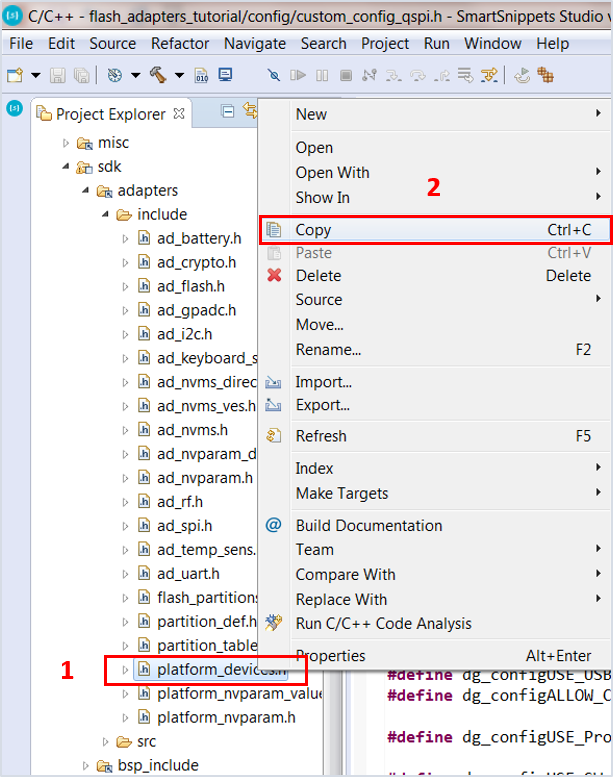
Fig. 12 Creating a platform_devices.h Header File, Step 1
- Right-click on the
/configfolder (3) and select Paste (4).
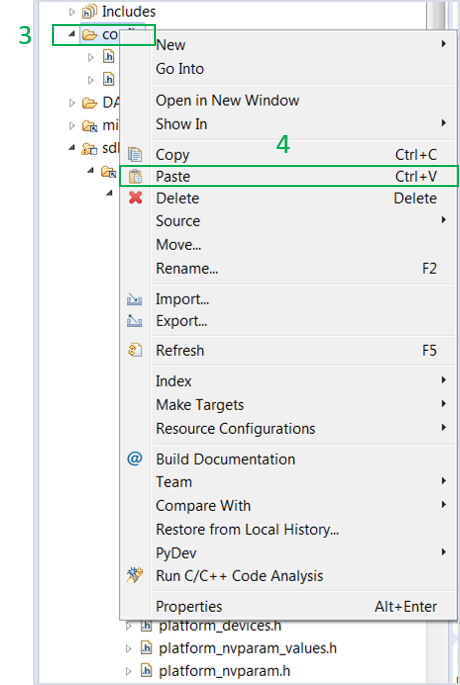
Fig. 13 Creating a platform_devices.h Header File, Step 2
Note
If a new platform_devices.h file is not created in /config directory,
the application will inherit the default macro definitions from /sdk/adapters/include/platform_devices.h.
- In the target application, add/modify all the required code blocks as illustrated in the Code Overview section.
Note
It is possible for the defined macros not to be taken into consideration instantly. Hence, resulting in errors during compile time. If this is the case, the easiest way to deal with the issue is to: right-click on the application folder, select Index > Rebuild and then Index > Freshen All Files.
- Build the project either in Debug_QSPI or Release_QSPI mode and burn the generated image to the chip.
- Connect the EEPROM module to the Pro DevKit. Fig. 14 illustrates the pin connections required to configure the 24LC256 module. For more information on the EEPROM module used, read the manufacturer datasheet.
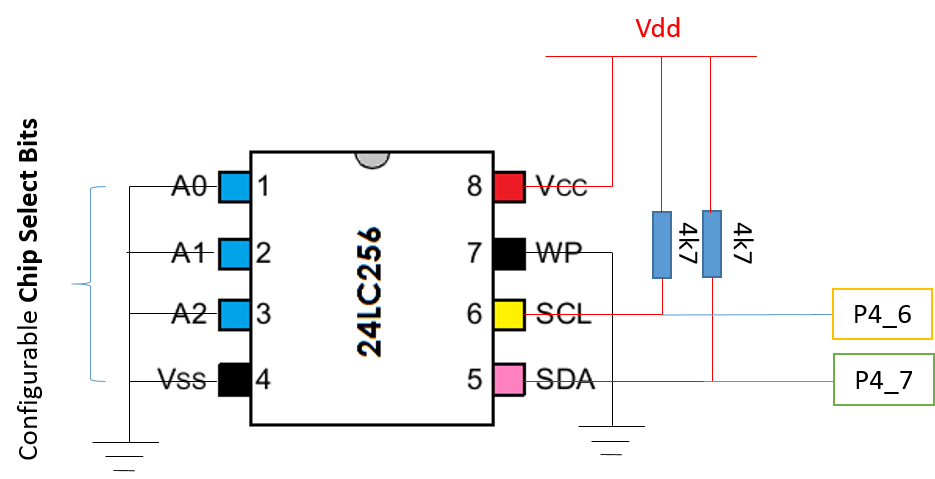
Fig. 14 Configuring the 24LC256 EEPROM Slave Device
- Since all the Chip Select Bits are connected to ground (that is, logic ‘0’), the resulting device address is set to 0b1010000 (0x50). Thus, the master device (DA1468x chip) should reference the EEPROM using this address.
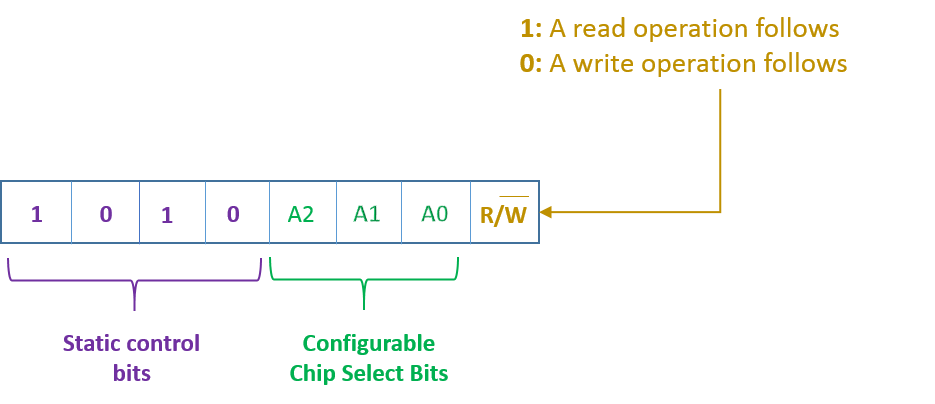
Fig. 15 Control Byte of 24LC256 EEPROM Chip
Note
The Control Byte is the first byte sent by the I2C master controller (DA1468x) at each I2C operation. Given the current EEPROM configurations, possible values are: 0b10100001 (0xA1) when a read command is executed or 0b10100000 (0xA0) when a write command is executed.
- Press the K2 button on Pro DevKit to start the chip executing its firmware.
- Open a serial terminal (115200, 8-N-1) and press the K1 button on Pro DevKit. A debugging message is displayed on the console (1) indicating both the progress and status of the I2C write operation.
- Press the K1 button on Pro DevKit again. A debugging message is displayed on the console (2) indicating the status of the I2C read operation. A message indicating whether or not read data matches the previous written data is also displayed.
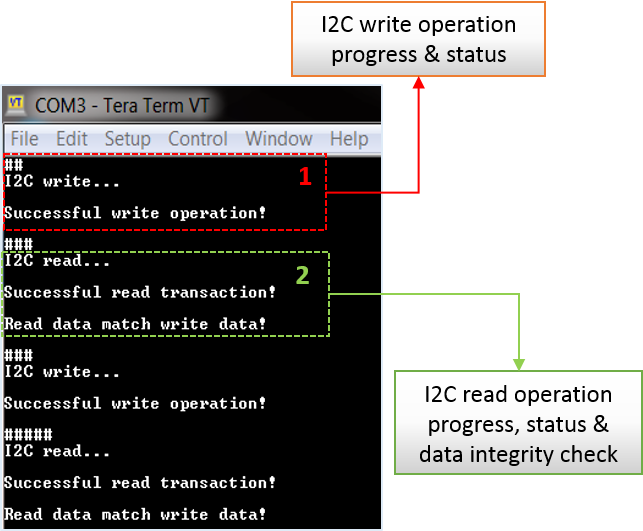
Fig. 16 Debugging Messages Indicating both the Progress and Status of an I2C Transaction
4.2. Verifying with a Logic Analyzer
This step is optional and is intended for those who are interested in using an external logic analyzer to capture the I2C signals during a transaction.
- With the whole system up and running, open the software that controls the logic analyzer. For this step a logic analyzer from Saleae Incorporation and its official software was used.
- Connect the logic analyzer to the Pro DevKit. To do this, you should:
- Connect a channel from the logic analyzer to P4_6 pin of Pro DevKit. This is the
Clocksignal (SCL). - Connect a channel from the logic analyzer to P4_7 pin of Pro DevKit. This is a bidirectional line both for sending and receiving data (SDA).
- Connect a channel from the logic analyzer to P4_6 pin of Pro DevKit. This is the
- Press the K2 button on Pro DevKit to reset the device.
- Press the K1 button on Pro DevKit and capture the I2C write transaction. Fig. 17 illustrates only the first two of the total written bytes.
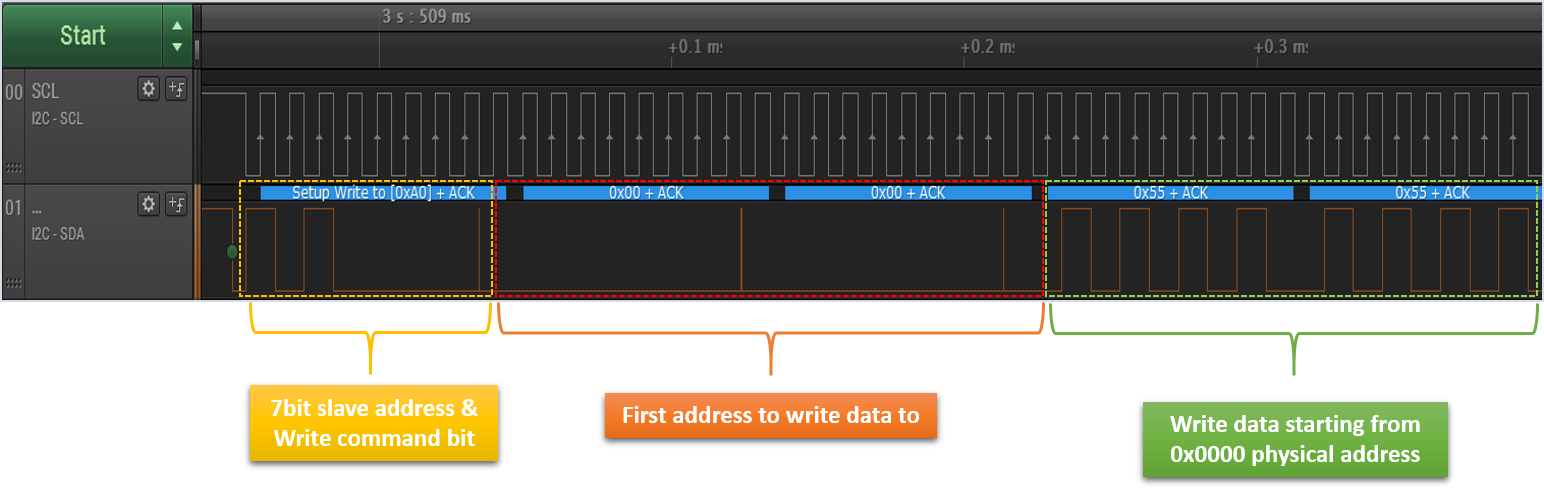
Fig. 17 I2C Write Transaction Captured using a Logic Analyzer
- If the I2C write operation was successfully executed, the Acknowledge Polling procedure takes place.
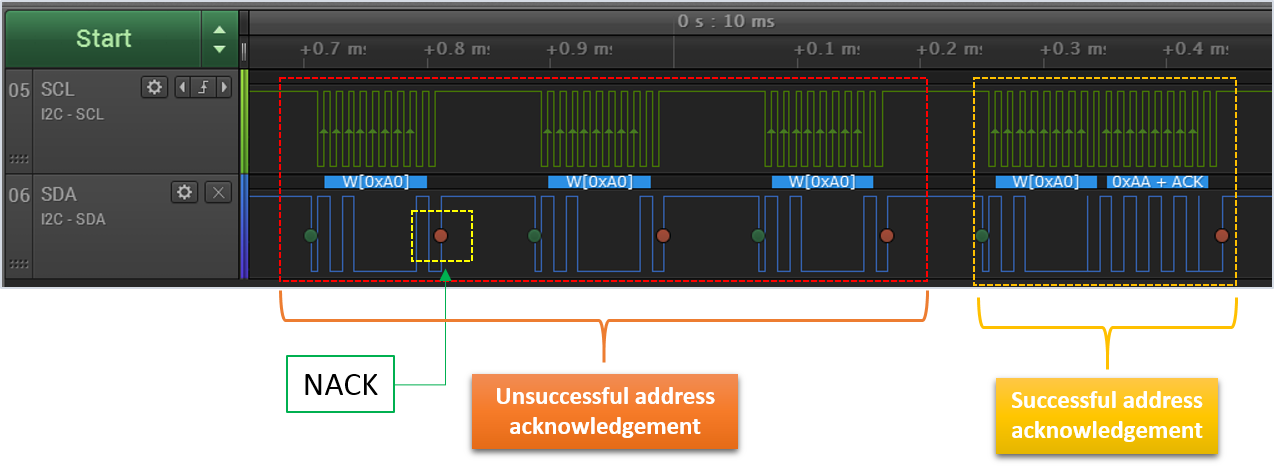
Fig. 18 Polling ACK Procedure Captured using a Logic Analyzer
- Press the K1 button again on Pro DevKit and capture the I2C read transaction. Fig. 19 illustrates only the first two of the total read bytes.
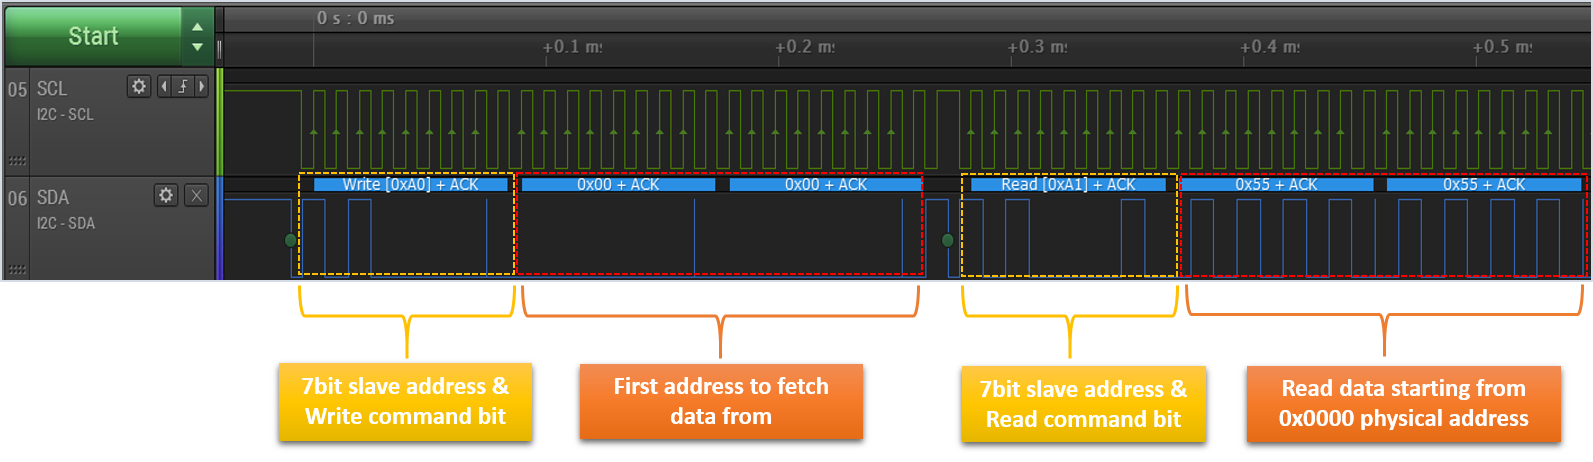
Fig. 19 I2C Read Transaction Captured using a Logic Analyzer