PTX1xxR POS Config Tool-7.3.0-01ba3805 User Manual
This is the online user manual for the software “PTX1xxR POS Config Tool” version 7.3.0. PTX1xxR POS Config Tool can be used to generate configuration data for the PTX1xxR POS SDK version 7.x.y. The software can be used without any additional hardware attached. A part of the PTX1xxR POS Config Tool software are test applications which can be started from the PTX1xxR POS Config Tool user interface. These test applications may require hardware access (USB ports for example).
This user manual is provided in English only. For assistance in other languages please contact your local Renesas Electronics Corp. representative.
Features
The software supports the following platforms and operating systems:
Windows 10 x86 64-bit
Ubuntu 20.04 LTS x86 64-bit
This document is valid for all these platforms, platforms specific information is explicitly highlighted.
PTX1xxR POS Config Tool application build for usage with POS SDK v7.1.x.
Current PTX1xxR POS Config Tool version supports following hardware:
PTX100R-EB-ST-QFN56-POS/IoT v1.5
PTX130R-EB-ST-QFN56-POS/IoT v1.1
The main application features are:
Configuration of receiver settings
Configuration of transmitter settings
Load configuration from file
Store configuration to file
Generate a configuration file for Renesas Electronics Corp. SDKs
Q factor measurement (Q-Measurement)
Shutdown Temperature calibration
Detection of temperature and current limit violation
Generate a start-up polling code for Renesas Electronics Corp. SDKs
RSSI and Rx Threshold Type A/B/F measurement
LPCD minimum I/Q-Limit measurement
EMVCo DTE test application
HCE T4T application
HCE RX Detection Threshold measurement
FeliCa M-class DTE application
PRBS test signal generator application
Installation Notes
PTX1xxR POS Config Tool release package is distributed as a zip archive. To extract the content of the package open the Windows explorer, right-click file named PTX1xxR_POS_Config_Tool_v7.3.0.zip and select Extract All… from the list. In the windows that pops up press the Extract button and the content of the archive will be extracted to a specified folder.
There should be following content present in the archive:
LINUX-x86-64Bit folder : The application for Ubuntu 21.10 (x86) 64-bit (minimal installation)
WINDOWS-x86-64Bit zip archive : The application for Windows 10 (x86) 64-bit
Installation on Linux
An AppImage package can start a PTX1xxR POS Config Tool application without any installation on a LINUX distribution.
download the PTX1xxR POS Config Tool from the customer support portal
extract the zip archive
set the execute flag of the AppImage file
start the AppImage file
# starting first time
mkdir my_appimage
unzip <zip archive> -d my_appimage
cd my_appimage
chmod +x <AppImage file>
./<AppImage file>
# starting next time
./<AppImage file>
Starting the AppImage for the first time you must agree to displayed license terms.
Installation on Windows
The following step-by-step instruction will guide you through the software installation procedure.
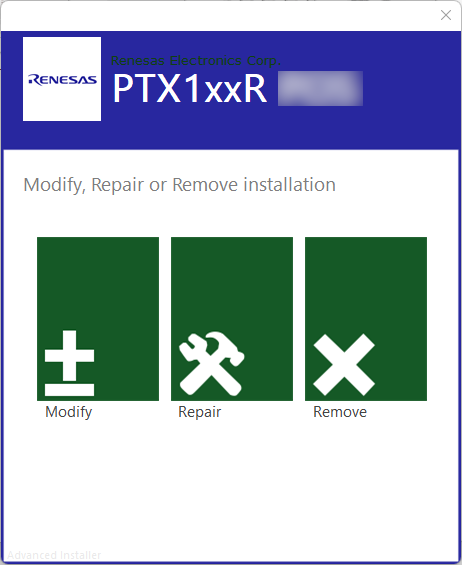
Double-click the installer executable in the Windows Explorer
In case a previous version of PTX1xxR POS Config Tool is installed on your system it can be required to uninstall that version first, if you don’t see a windows as shown in the figure below skip the next step and proceed with step 5
Press the Remove button and in the confirmation page press again the Remove button
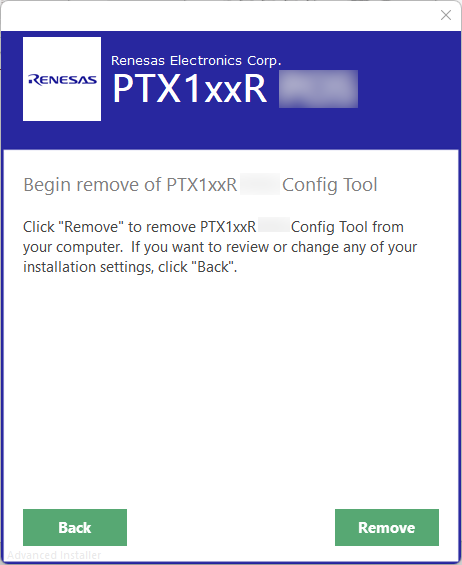
Once the removal operation succeeded confirm by pressing the Finish button and re-start with step 1
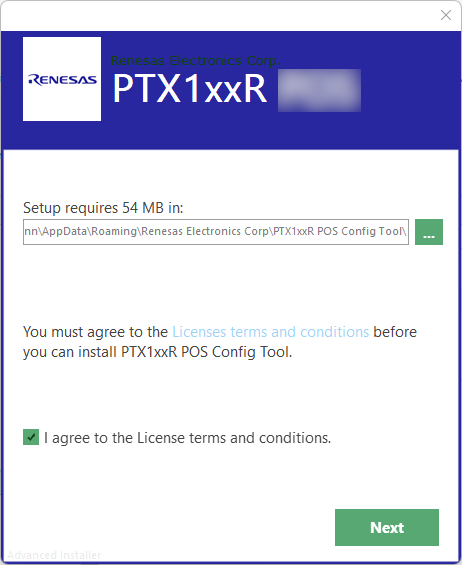
Click the box left to the text “I agree to the License terms and conditions” as shown in the figure below and press the Next button afterwards
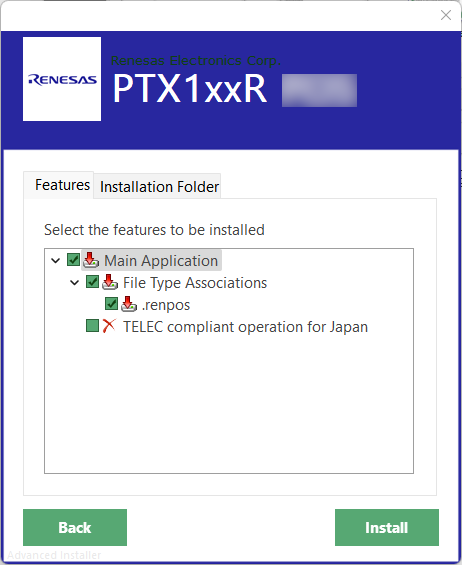
Press the INSTALL button to start the installation. You might optionally exclude the file association feature from the installation by clicking on the “File Type Associations” checkbox. In case the product shall be used for Japanese market enable the feature “TELEC compliant operation for Japan” by clicking on the corresponding checkbox (for compliance reasons certain features will not be available when using that option).
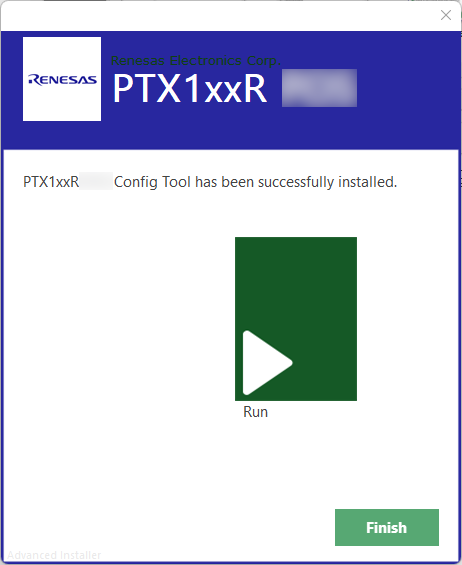
Press the Run button to start the PTX1xxR POS Config Tool application, the installer windows will close automatically
FTDI installation (automatic/manual)
In order to access evalboard functionality, corrsponding FTDI driver must be installed. Normally Windows will download and install it automatically, but there might be a problem in case Windows Update server is not available and driver cannot be installed automatically during the first time the device gets connected.
If this is the case, refer to following driver download page: “Virtual Com Port Drivers download” and original Application Note from FTDI: “Application note”
Graphical User Interface
To start PTX1xxR POS Config Tool on Windows, double-click the shortcut called “PTX1xxR POS Config Tool” on your desktop. A user interfaces as shown in the figure below will be displayed.
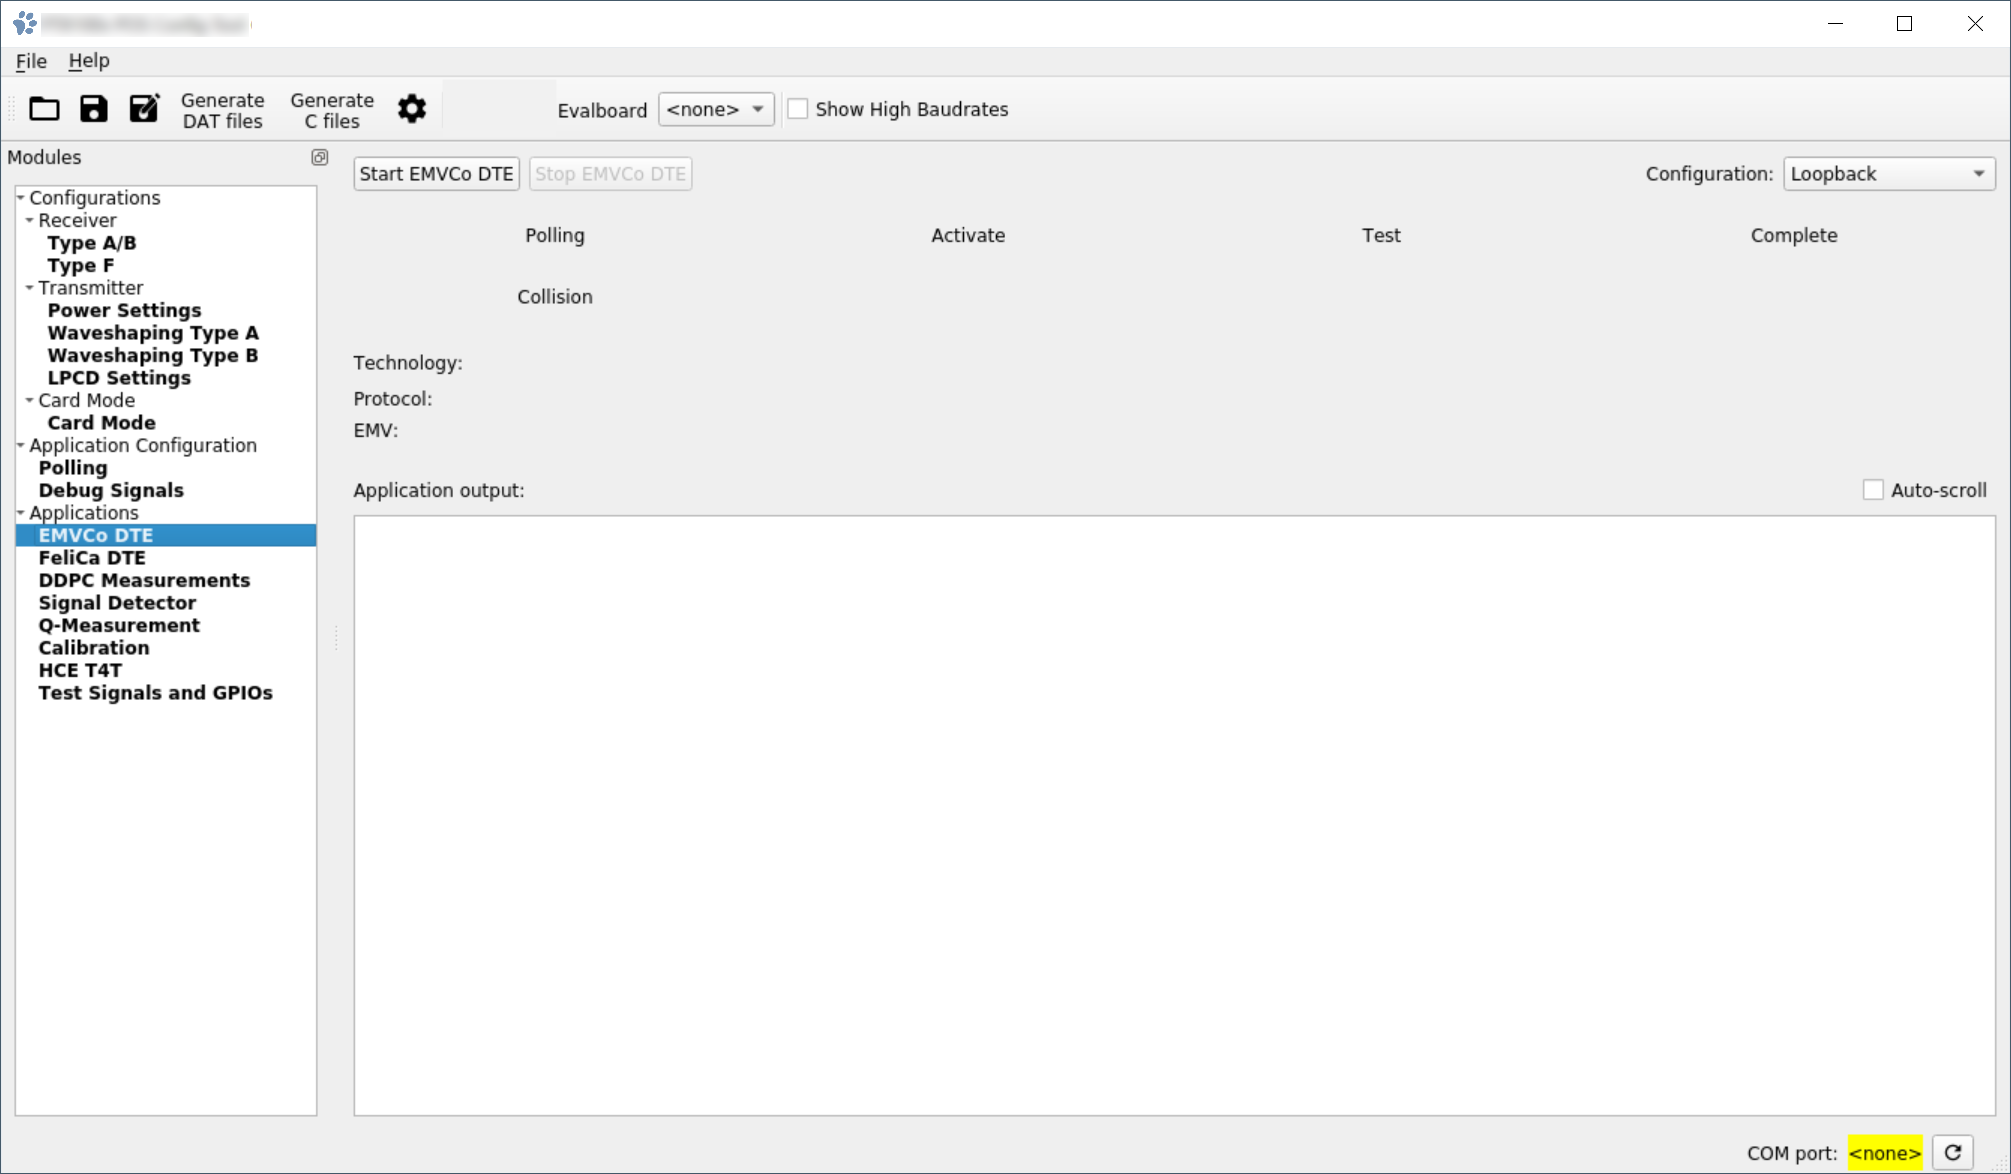
The menu bar offers access to different operations such as loading a configuration from a file or opening the offline user manual. The following sections explain the specific operations in more detail.
Under the “Modules” it’s possible to choose different configuration and measurement views.
Toolbar
The application toolbar is located right below the menu bar. Using the toolbar buttons provides quick access to the actions available via the File and Edit menus. In addition, the toolbar allows configuring the serial port used for all features of the application which require hardware access.
The screenshot below shows the content of the toolbar including a serial port selection box for the “Evalboard” device. Note that depending on the PTX1xxR POS Config Tool version the supported devices and therefore the label beside the drop-down serial port selection can differ. It will refer to an equally named Renesas Electronics Corp. hardware device. In case operation of multiple devices is supported for a PTX1xxR POS Config Tool version there will be multiple drop-down serial port selections available.

To select the serial port for a connected PTX1xxR device, click the drop-down list to select the matching port identifier. The serial port is opened/closed every time access to a PTX1xxR device is required.
The settings for high baudrates (212k, 424k, 848k) can be specifically shown or hidden by the “Show High Bitrates” checkbox. Note that this checkbox is disabled when having installed the PTX1xxR POS Config Tool using the TELEC compliant operation for Japan option.
Statusbar
The statusbar is located at the bottom edge of the main application window. At the left side momentary status messages are displayed. The controls on the right side are placed permanently and display general status information, such as the Evalboard type and currently active serial port (COM port). Rightmost control is a button that can be used to check the serial device availability. If the background color of the COM port name is grey then the port is available, if the background color is yellow then the port is not available and if the background color is green then the port is in use. The Evalboard type is displayed only in case there is an active connection to the device (COM port background is green).
Settings … configuration view
In the File menu click the Settings … entry to open the application settings dialog window.
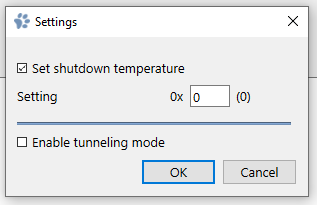
Set shutdown temperature
The PTX1xxR SDK uses the shutdown temperature, a chip-specific binary value, which can be measured using the Calibration application.
It is possible here to override the default value by checking the checkbox and specifying the number in the Setting field. If the checkbox is unchecked, the application will use the default configuration.
Changes made to this block become effective on the next application start.
Enable tunneling mode
Using the native UART interface of the PTX1xxR requires the hardware flow control signals (RTS, CTS, etc.) to be enabled and wired correctly. In case communication to the PTX1xxR happens via tunneling firmware - an MCU translates the UART communication frames to SPI toward the chip - the hardware flow control signals are not required, they may be used for other purposes (ie. resetting the MCU). This setting shall be enabled if the HW flow control signals should not be driven.
Transmitter configuration view
Under Modules select the Configurations/Transmitter entry to open the transmitter configuration view.
The transmitter configuration view contains multiple tabs which group different configuration blocks. Click on the tab title to open the view for that specific tab.
Power Settings
Allows selecting wave amplitude for the transmission power when in “High Power Mode” and “Reduced Power Mode”. There are two sliders. One is called “CW” (Continuous Wave) and can be used to set the sine wave amplitude for the CW wavebank. The other slider is called “MOD” and can be used to set the modulation index that is used for calculating the sine wave amplitude of the MOD wavebank.
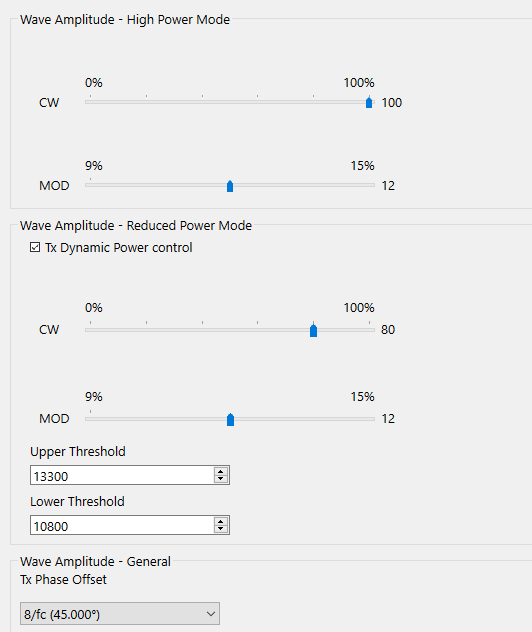
Wave Amplitude - High Power Mode group allows configuration of the continuous wave amplitude in high power mode.
Using the “CW” slider the continuous wave amplitude can be adjusted. Using the “MOD” slider the modulation index for technology Type B can be adjusted.
Wave Amplitude - Reduced Power Mode group allows to configure Dynamic Power Control’s settings.
In this group of settings you can configure the wave amplitude for the reduced power mode and set the upper and lower RSSI thresholds. Wave amplitude is specified in a range of 0% to 100%. This percentage value will be used to calculate a corresponding sine wave.
Warning! Reduced power wave amplitude is used by default when polling starts, only if “Tx Dynamic Power Control” is enabled the wave amplitude may switch to the High power wave amplitude.
Wave Amplitude - General group allows configuration of TX phase offset. Note that if using host card emulation there is a dedicated phase offset configuration available in the Card Mode view.
Parameters is used to change phase difference between receiving and transmitting RF signals.
The DDPC measurements allows the user to measure and set the upper and lower RSSI thresholds for switching power. See additional information under DDPC measurements application view for reading out these threshold variables.
Waveshaping Type A/B views
The PTX1xxR supports customization of the RF waveform. For NFC technology Type A and B dedicated waveshaping patterns can be set for high- and reduced power modes as well as for different bitrates (106, 212, 424 and 848 kBit/s). Note that in most cases it is not required to have special settings for higher bitrates.
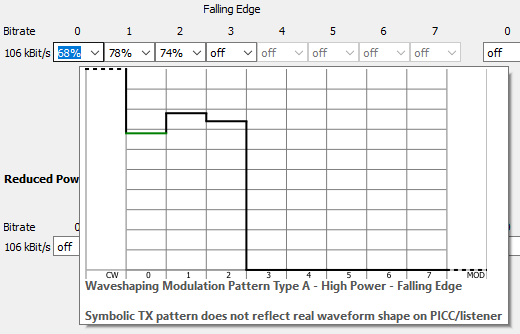
The waveshaping takes place either on the transition from CW to modulated wave (falling edge) or from modulated wave back to CW (rising edge). The wave amplitude of the last eight signal periods (also called slot) for falling edge and first eight signal periods for rising edge can be set using the modulation edge configurator as shown in the figure below.
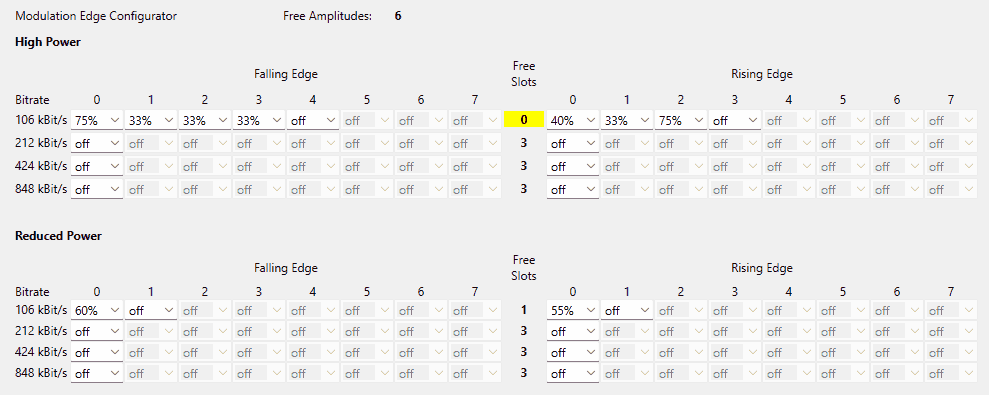
Using the selection boxes the wave amplitude percentage can be directly specified or - if no waveshaping shall be applied - the setting “off” can be selected to use the CW wave amplitude level for that and subsequent slots. Per bitrate and power mode a total of 3 different wave amplitude levels can be selected for NFC technology Type A and 2 for Type B.
During configuring each bitrate settings, the Free Slots counter decreases as soon as a new amplitude gets assigned for that particular bitrate (either falling- or rising edge). Once the counter reaches 0, no new amplitudes may be introduced. The total number of possible amplitudes are limited by hardware. The number of remaining amplitudes is displayed next to the Free Amplitudes, which will also decrease after entering a new wave amplitude to any of the waveshaping pages. To introduce a new amplitude when either counter reached zero, space must be freed up: all occurrences of another amplitude value - depending on the scope (bitrate or global) - needs to be set to another already existing value or “off”, thus the particular value gets removed from the cache. After that, the counter(s) will be incremented and the new amplitude value can be assigned.
Hovering a selection box triggers a tooltip that shows a visualization of the waveshaping pattern. The part of the curve which is colored green corresponds to the selection box the mouse is currently located at.
Expert notes on Wavebank indexing
The user of the PTX1xxR POS Config Tool gets a simplified view on the low-level configuration of the PTX1xxR, but in order to understand certain configuration limitations this chapter will give some more insight.
The PTX1xxR supports up to 20 wavebanks. A wavebank is a block of memory with 32 entries that allows to define the shape of a half period off the PTX1xxR RF output signal. The PTX1xxR POS Config Tool allows the user to configure wave amplitude values. These values are mapped to a wavebank memory block forming a sine wave with corresponding amplitude.
The following table shows the wavebank indices followed by their usage.
Index |
Usage |
|---|---|
1 |
CW High Power Mode |
2 |
CW Reduced Power Mode |
3 |
Low Power Card Detection |
4 |
Card Mode Full Power |
5 |
Card Mode Reduced Power |
6 |
Waveshaping |
7 |
Waveshaping |
8 |
Waveshaping |
9 |
Waveshaping |
10 |
Waveshaping |
11 |
Waveshaping |
12 |
Waveshaping |
13 |
Waveshaping |
14 |
MOD High Power Mode |
15 |
Waveshaping |
16 |
Waveshaping |
17 |
MOD Reduced Power Mode |
18 |
Waveshaping |
19 |
Waveshaping |
20 |
Waveshaping |
LPCD - Low Power Card Detection settings
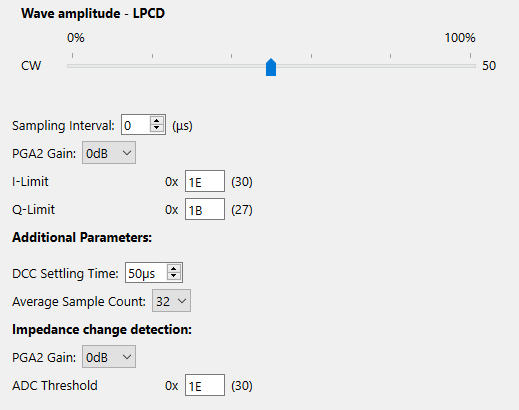
Configuration for LPCD. The sampling interval is specified as a value between 0..255 microseconds (μs) and specifies the time interval between taking ADC samples. Increase the interval to reduce the influence of distortions over the RF field or power supply. The resulting LPCD pulse width calculates as follows: “Average Sample Count (e.g. 16)” x “Sampling Interval” + ~75us.
DCC settling time can be configured between 20..255μs and the number of ADC samples for averaging can be configured as 6 discrete values. These options can be used to optimize the current consumption in LPCD mode, but improper configuration may lead to degraded performance and system stability issues.
Other values are entered using HEX digits (ie. 0..FF).
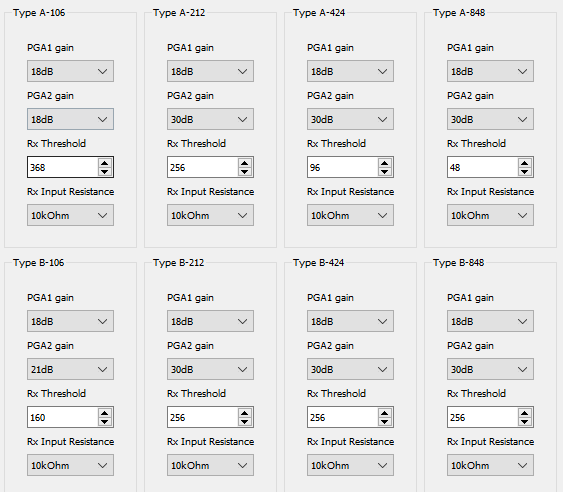
Receiver configuration view
Under Modules select the Receiver entry to open the receiver configuration view. This view allows to configure the receiver settings for Type A,B and F protocols. If no file has been loaded yet the controls will show the default settings. Use the controls to change any setting. If you need help about the meaning of a setting please leave the mouse pointer over the input value of your choice and wait for 2 seconds without moving the mouse. A tooltip will pop-up which informs you about the function and possible settings for that specific configuration element.

Card Mode configuration view
Under Modules select the Card Mode/Card Mode entry to open the card mode configuration view.
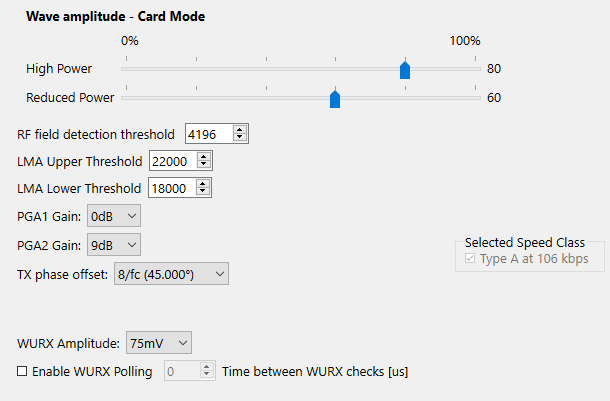
Settings configurable in this view are used in case the application polling configuration “Listen Type A” has been enabled.
TX Phase offset - use parameter to change phase difference between receiving and transmitting RF signals.
Applications
Signal Detector application view
Please note that this application works independently from the Receiver, Transmitter and Application polling configuration views (means that any configuration made in these views has no effect to the measurements). Under Modules select the Signal Detector entry. In the windowpane, a screen as shown in the figure below should appear.
The application connects to PTX1xxR hardware via a serial port which can be configured in the application toolbar.
Connect the hardware to the host system and press any of the available signal readout buttons afterwards. The corresponding measurement will start and during the measurement, the buttons will get disabled (grayed out).
When the measurement has finished the buttons will get enabled again and the measurement result will be displayed in the textbox next to the button. The readout can take up to 60 seconds to complete.
Use Apply button to set the signal strength of the corresponding receiver.
If the initialization of a PTX1xxR device fails or any other error occurs, an error message is displayed instead of a measurement value.
Note: Individual measurements can take up to 60 seconds and Rx Gain range based measurement will take ~15 sec/measurement. If running the full range of measurements can take a significant amount of time!
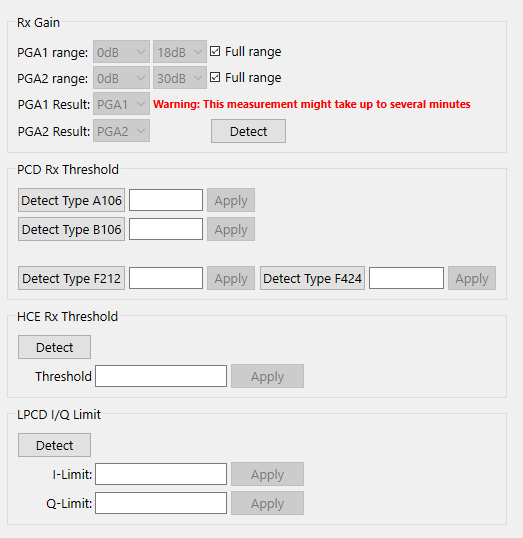
The application supports the following measurements:
RX Gain
The PGA settings are used to change the RF front-end gain settings. A higher gain setting ensures a higher communication range but will also increase the relative noise within ADC range. The automatic gain measurement delivers values where the ADC Noise is lower than 20% within full ADC range to ensure still a good internal signal quality with a maximum gain setting.
It is not recommended to increase the gain setting above these values because the additional noise may cause communication errors.
PCD RX Threshold
This measurement determines the internal threshold between noise and received real modulated data. The result is used as a good starting point and can still be adjusted by incrementing (less sensitivity, but more robust against noise) or decrementing (better sensitivity, but less robust against noise) to avoid false modulation detection.
HCE RX Threshold
This measurement determines the internal threshold between noise and received real modulated data. The result is used as a good starting point and can still be adjusted by incrementing (less sensitivity, but more robust against noise) or decrementing (better sensitivity, but less robust against noise) to avoid false modulation detection. The measurement can be done in two modes:
For maximum performance/distance - the device should be placed in a position where there is no RF field
For NFC forum usage - the device should be placed in a position where the rf-field that must be ignored is present
LPCD I/Q Limit
With this measurement, the default LPCD- ADC fluctuation is measured with LPCD gain configured and Tx enabled (CW). The results are the minimum detection thresholds of I- and Q- branch and can still be adjusted by increasing (less sensitive, lower false alarm rate) or decreasing (better sensitivity, higher false alarm rate)
Debug Signals application configuration
The PTX1xxR chip has several general-purpose input/output (GPIO) pins and analog test (ATEST) pins, which can be configured to output a specific signal, to help fine-tuning or debugging the user application. This configuration view allows the user to select the signals for monitoring.
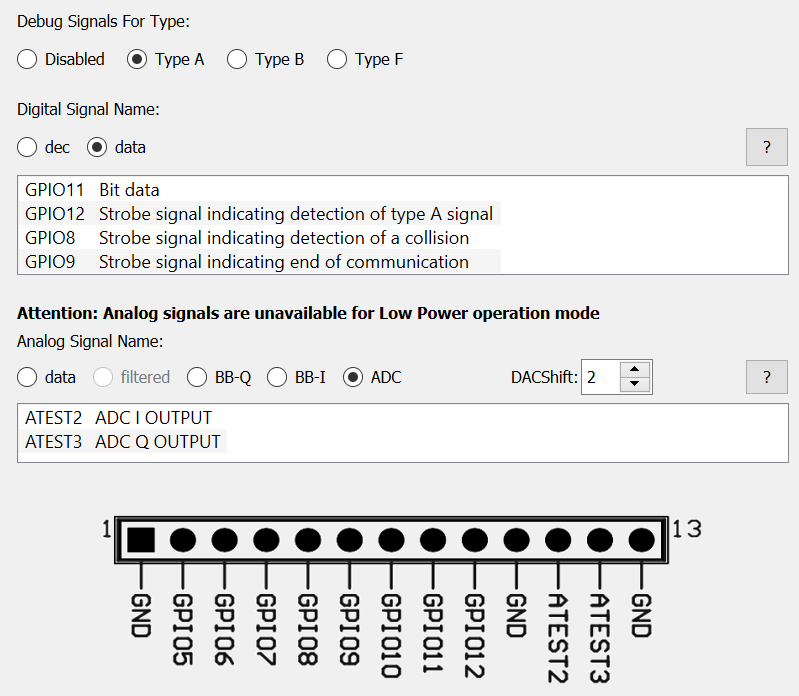
The debug signals can only be used with the EMVCo DTE Application. In any other case the debug signals will be ignored and disabled.
If an analog test signal is not strong enough to observe it correctly, the DACShift parameter can be used to adjust it. Although, using a value that is too high will lead to distortions on the waveform.
There are different analog and digital signals available for each technology type. Hovering the mouse pointer at the ?, the valid waveform will be shown for the selected signal for easier comparison. Not all signals are available for each technology type.
The image at the bottom of the pane shows the pin-header available on the PTX1xxR Evalboard with the pinout for easier identification of the pins.
Please note, that the analog signals will be overridden if using the Low Power operation mode.
Polling application view
Under Modules select the Polling entry. In the window pane a screen as shown in the figure below should appear.
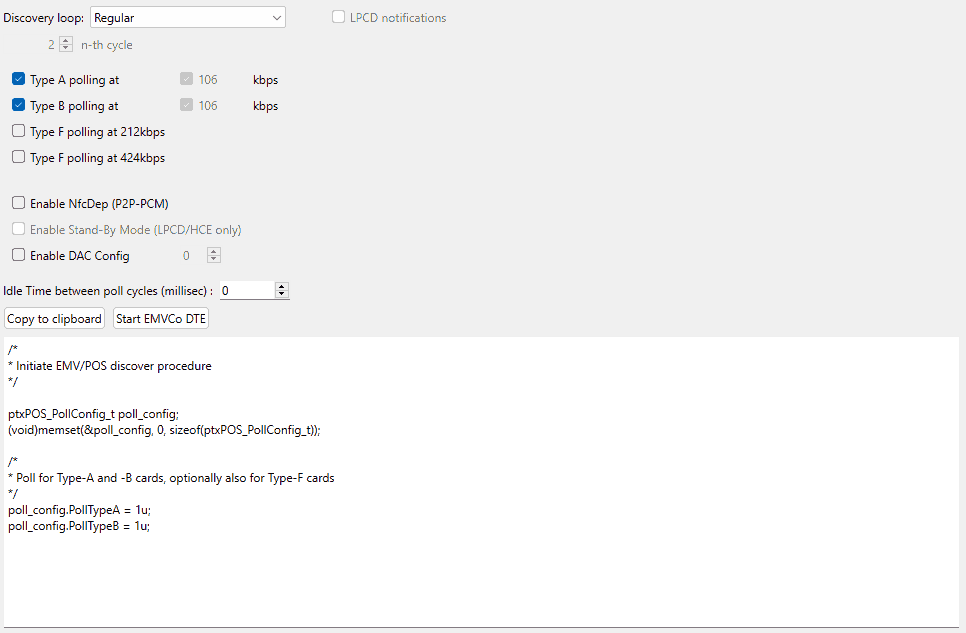
Use this module to generate the initialization code for the polling initialization of the REN SDK.
The discovery loop setting allows to configure the general polling loop behavior. Setting Regular will configure the PTX1xxR to poll for the selected technologies in an interval as defined by the Idle time between polling setting. Setting Reduced-Power will let the PTX1xxR perform LPCD polling as defined in the LPCD Settings view. Once an object in proximity has been detected by LPCD the PTX1xxR will switch to regular polling. Setting Reduced-Power every n-th cycle will perform LPCD polling but will cause the PTX1xxR do to a regular polling every n-th time. It is recommended if a reduced power mode is selected that also the Stand-By mode should be enabled.
Press Copy to clipboard to copy the generated code to clipboard.
Press the Test EMVCo DTE button to test the EMVCo DTE Loopback configuration.
Type F polling bitrates are mutually exclusive, so it’s possible to choose either 212kbps or 424kbps, but not both.
For Type A and B polling, multiple communication speeds are available. By default, both types are configured to communicate at 106kbps. Multiple speeds can be selected for each type but the PTX1xxR is responsible to select the highest speed supported by the card. High bit rates should only be used for non-EMVCo applications.
The DAC (digital analog converter) output of the chip has 5 bits resolution, therefore the accepted values are 0-31.
Checking the LPCD Notifications checkbox will lead to a periodical request of the LPCD notification counter in the EMVCo DTE Application and display the result in the status bar. This shows the number of wake-ups happened before a successful activation. This information is useful to prove if the LPCD settings are configured correctly. The counter stops counting at 255. This feature works with an Idle Time value greater than 0 only.
EMVCo DTE application view
Under Modules select the EMVCo DTE entry. In the window pane a screen as shown in the figure below should appear.
Purpose of the EMVCo DTE (Device Test Environment) is to assist in testing of various REN features during hardware bring-up. EMVCo DTE application is NOT intended to be used as a certification or verification tool of any kind. For description of potential applications see Using EMVCo DTE application.
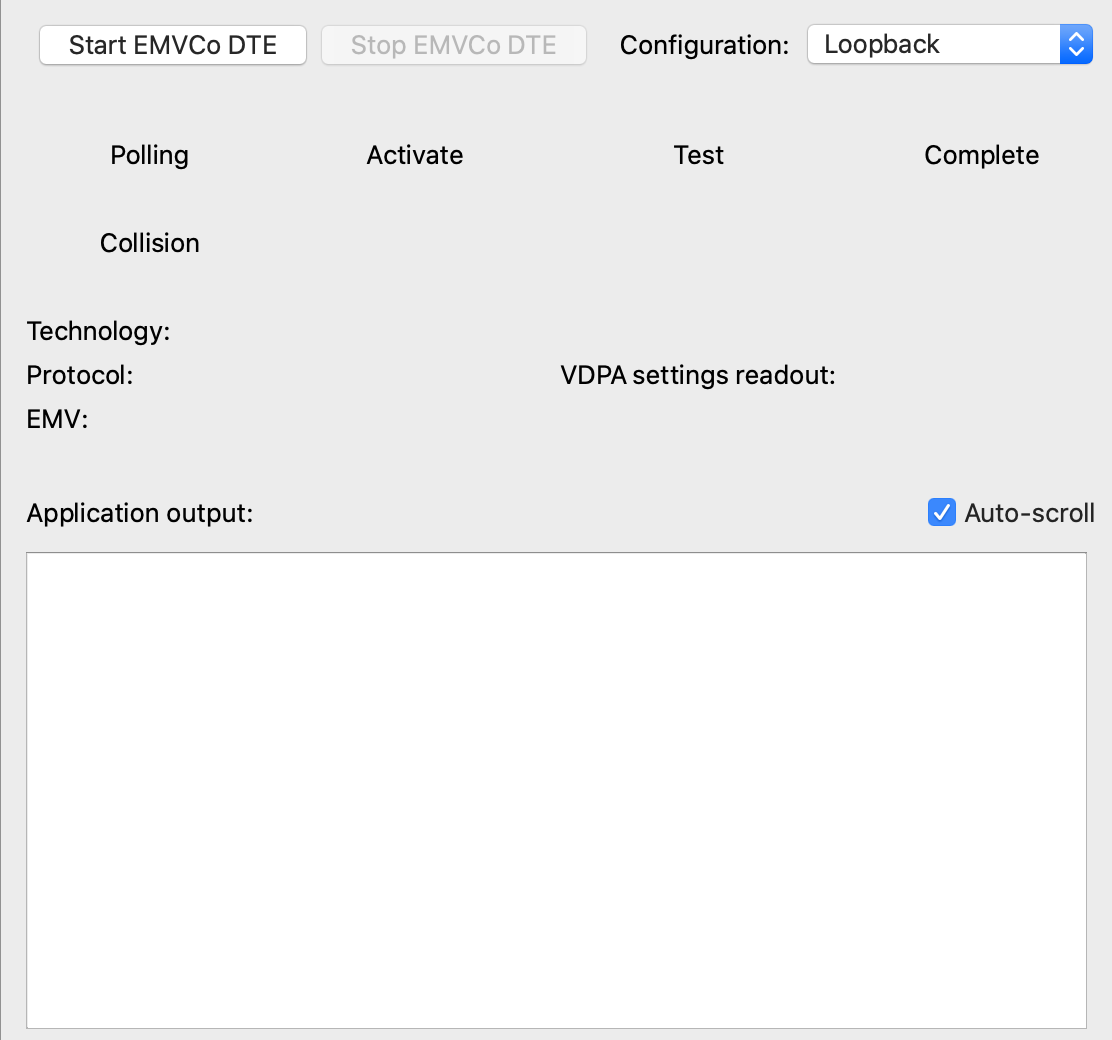
This application uses a serial port connected which can be configured in the Settings … dialog of the File menu. Please connect the hardware to the host system and press the Start EMVCo DTE button afterwards. The EMVCo application will start and display any information about its state to the Application output textbox. Press the Stop EMVCo DTE button to stop the application. This will close the connection to the hardware.
To always have the latest messages from the EMVCo DTE application shown in the Application output box the Auto-scroll check-box can be set. Doing so will automatically move the message box scroll bar to the buttom.
In case the application has started successfully, the Polling field will become green and cards of appropriate type will be polled for.
Using configuration Loopback uses polling configuration from the Polling application view. Additionally to running the Loopback Application with a user defined polling configuration, other options are available from Configuration dropdown. To run a specific application configuration simply select it and start the application.
Configuration EMV Transaction A and EMV Transaction B are used for specific EMVCo DTE application functions (see Using EMVCo DTE application section).
Configuration Continuous Field is used to generate a continuous RF field.
Configuration Field reset is used to generate a continuous RF field that is reset every 100ms.
Configuration RSSI measurement will enable live RSSI value readout during continuous field mode. In this mode, there is no RF communication.
Using EMVCo DTE application
This section describes how functions the PCD vendors must support for a DTE can be executed using the EMVCo DTE application. Note that the EMVCo DTE application is not intended to replace a DTE that is implemented by a PCD vendor for EMVCo certification. For that reason also the user interface does not follow the DTE guidelines but offers a modern look and feel. For a detailed description about how to implement the functions for developing a DTE please refer to the POS API Application Note DTE Support.
In case DDPC is enabled in the RF configuration note that DDPC is handled differently for specific DTE operations. Whenever the field is turned on, required DDPC power levels are determined shortly afterwards and stay fixed until the next time a field reset happens. If for any function (e.g. EMV Transaction A or EMV Transaction B) no field reset is included in the command execution that means that DDPC power levels are determined only once after the function has been called. Exception to this is the Continuous Field operation where DDPC is checked periodically.
These are the PCD functions that can be executed using EMVCo DTE application:
Carrier
Select Continuous Field configuration. Press the Start EMVCo DTE button to turn the carrier on. Press the Stop EMVCo DTE button to turn the carrier off.
Polling
Configure required polling technologies under Polling application view. Press the Start EMVCo DTE button to initiate the polling. Press the Stop EMVCo DTE button to stop the polling.
Reset
Select Field reset configuration. Press the Start EMVCo DTE button to turn the carrier on. Every 100ms a field reset will be performed with at least 5.1ms field-off time. Press the Stop EMVCo DTE button to stop.
Power-off
Select Continuous Field configuration. Press the Start EMVCo DTE button to turn the carrier on. Now arm the trigger on the testbench. Press the Stop EMVCo DTE button to turn the carrier off.
WUPA and WUPB
Select Loopback configuration. Select Type A polling / Type B polling under Polling application view. Press the Start EMVCo DTE button to initiate the polling for the specified technology and continuously send WUPA/WUPB commands. Please note that executing WUPA/WUPB commands in single-shot mode is not supported. Press the Stop EMVCo DTE button to stop the polling.
TRANSAC_A and TRANSAC_B
Select EMV Transaction A / EMV Transaction B configuration. Press the Start EMVCo DTE button to continuously send a Type A or Type B set of commands defined as TRANSAC_A / TRANSAC_B. Press the Stop EMVCo DTE button to stop the transmission of the commands.
Temperature and current limit violation
Running the EMVCo DTE application enables the safety features of the PTX1xxR.
In case on of the following events happen the application will stop autonomously:
Current limit violation
Shutdown temperature reached
In case the driver current is limited by the overcurrent protection block (but not yet reached the overcurrent limit) the user is informed by a blinking red status bar text “Current limiting active”.
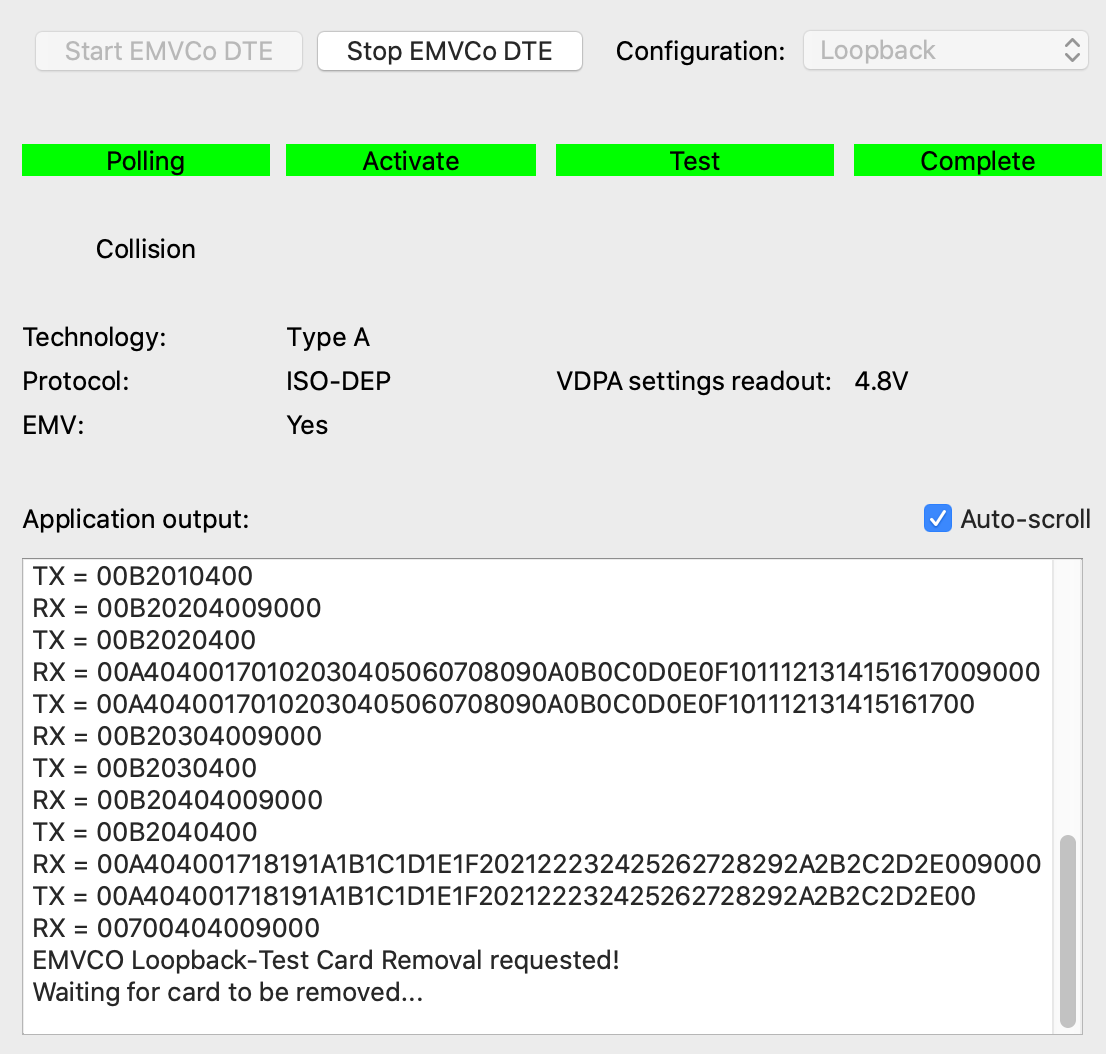
DDPC measurements application view
To be able to perform RSSI threshold measurements, “Tx Dynamic Power Control” must be enabled. “High Power” settings are linked to the “Power Settings” -> “Wave amplitude - High Power Mode” CW slider and and “Low Power” settings to the “Power Settings” -> “Wave amplitude - Reduced Power Mode” CW slider. The boxes can be updated by the user in the DDPC measurement page or via the CW sliders.
By pressing the “Read RSSI” button, the tool will read the RSSI value for each wave amplitude and will display the results in the “Threshold” box.
By pressing the “Apply to config” button, the according threshold will be set in the “Power Settings” view. The user can set also manually the threshold but in this case “Apply” hysteresis checkbox should be unchecked.
Readouts number allows to specify number of readouts to perform (average values are returned). More readouts might give better average numbers, when smaller readout number performs measurement faster.
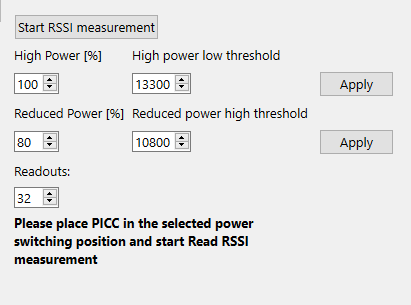
FeliCa DTE application view
This application can be used to perform FeliCa-DTE(M-Class performance- and protocol testing). The 2 types of tests are available in a tab control:
For each test, the parameters need to be configured and the button “Start FeliCa DTE” shall be pressed. Some tests (usually Performance-tests) take long time if there is no card in the field, therefore pressing the button “Stop FeliCa DTE” may be used to abort a running test.
The log window may be cleared by pressing the “Clear” button and it also has an optional autoscroll feature to make sure the latest results output is visible at the bottom.
Performance tests
These tests are referring to document FeliCa Reader/Writer RF Performance Certification Specification Ver.1.52. The desired bitrate, the number of tests and the timeout may be configured before start.
After the test execution has finished, the results will be printed in the log window using the officially recommended output format, where the circles (“O”) mean successful test, dots (“.”) mean unsuccessful test. The test results are grouped in a block of 50 with a partial summary about the success rate on the right column. The last line shows the success rate of total number of tests executed.
Reader/Writer digital protocol test
These tests are referring to document FeliCa Reader/Writer Digital Protocol Requirements Specification Version 1.22.
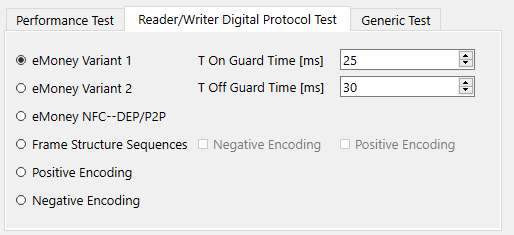
The test names refer to following locations in the document:
Test name |
Location in requirements specification document |
|---|---|
eMoney1 |
Sequence 1 |
eMoney2 |
Sequence 2 |
eMoneyNFC |
Sequence: Support e-Money service and NFC-DEP(F) |
FrameStructure |
Table 3: Sequence |
SetDPPOS |
Table 4: Commands and Responses for setting the DP TestBoard |
SetDPNEG |
Table 4: Commands and Responses for setting the DP TestBoard |
The FrameStructure test has the option to precede it with positive or negative encoding.
Generic test
The user can define its own data to be transmitted. Each line is transmitted separately, then awaiting the response.
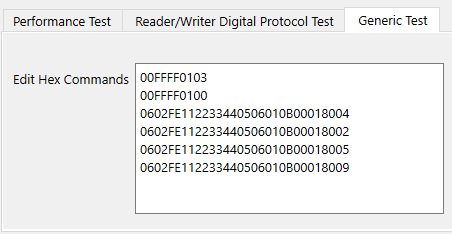
This test defines free hex data line by line. Allowed characters are 0-9, A-F, blank and return to finish the line. Each byte of the command sequence consists of 2 hex character. A single hex character is not allowed(shown as a red line). Blanks between the bytes are ok for better readability.
After the test execution has finished, the transmitted and received data bytes or an error message will be printed in the log window.
HCE T4T application view
Under Modules select the Applications -> HCE T4T entry. In the windowpane a screen as shown in the figure below should appear.
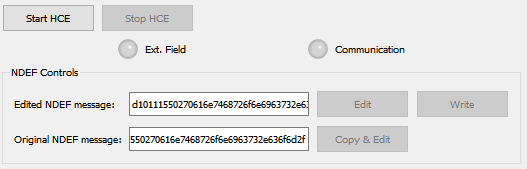
This application allows the operation of the PTX1xxR in host card emulation mode. When running the application a reader device (e.g. an NFC enabled smartphone) can be used to read the tag’s content. As default NDEF message the URL https://www.renesas.com is used which, in case the reader application supports it, will trigger the default web-browser of the device to open the website https://www.renesas.com.
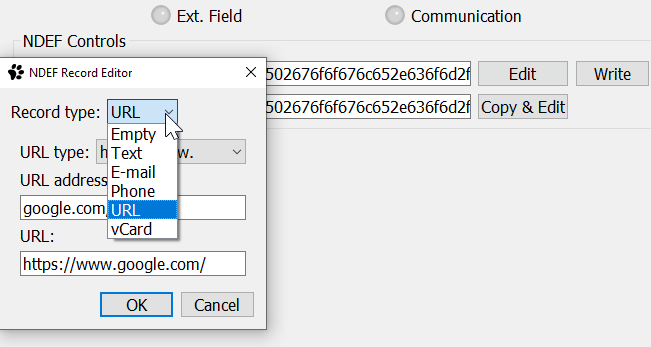
Press Start HCE to start host card emulation. When RF field presence is detected the LED “Ext. Field” will turn green. In case a reader device is present the LED “Communication” will turn yellow whenever there is data exchanged between the reader and emulated card.
Copy & Edit - does allow to edit the predefined NDEF message
Edit - allow to modify existing or create new NDEF message
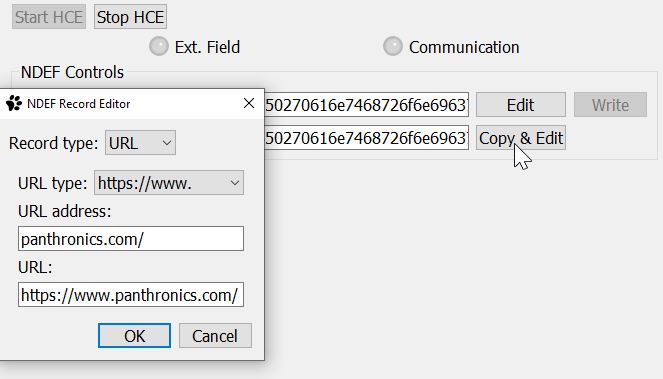
Write - will trigger setting new NDEF message content of the emulated card. The record type can be URL, empty, text, email, phone or vCard.
Q-Measurement application view
The Q-Measurement is not available when having installed the PTX1xxR POS Config Tool using the TELEC compliant operation for Japan option.
Note that this application works independently from the Receiver, Transmitter and Polling configuration views (means that any configuration made in these views has no effect to the measurements).
Under Modules select the Q-Measurement entry. In the windowpane a screen as shown in the figure below should appear.
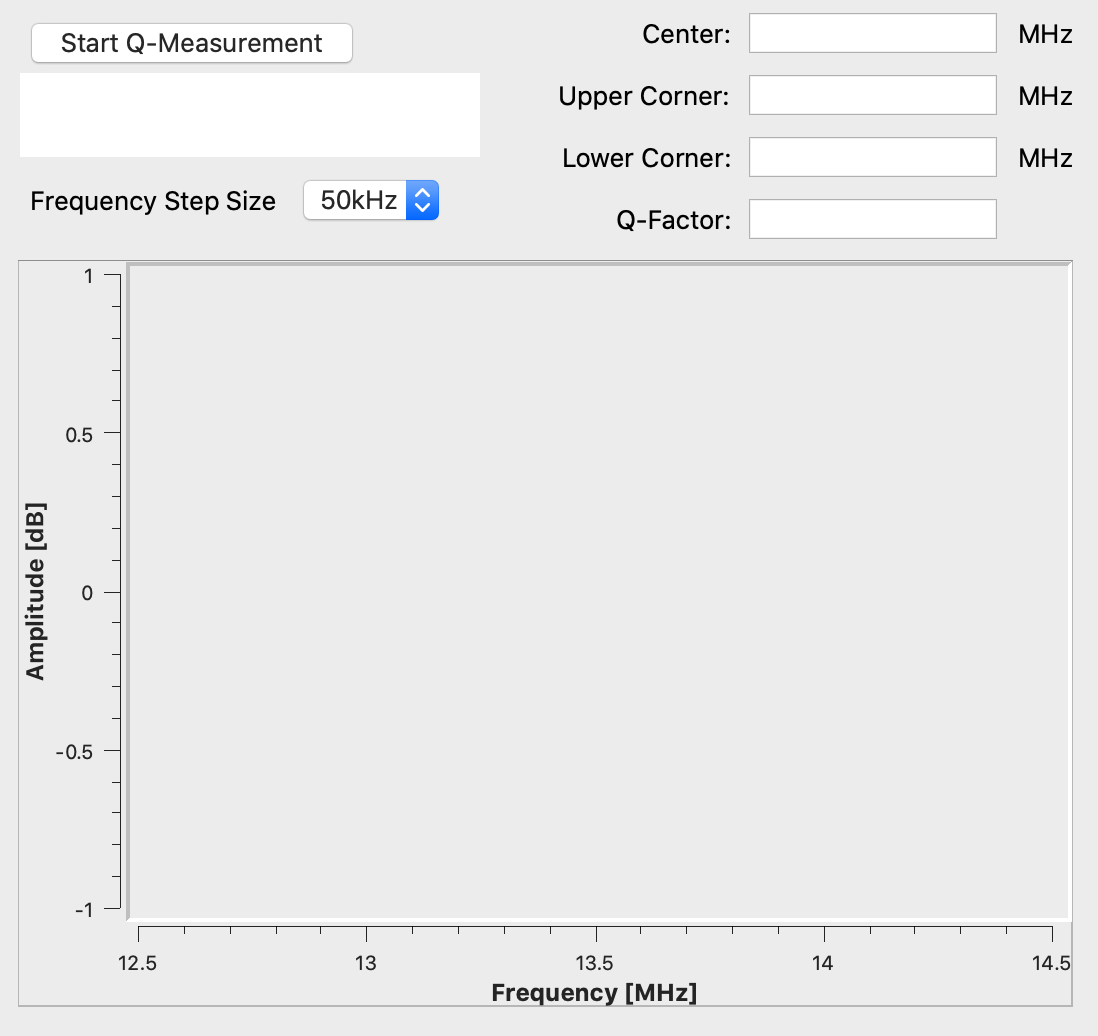
The application will trigger measurements for the frequency range between 12.46MHz and 14.76 MHz. Depending on the chosen frequency step width the application may run for some minutes.
When all measurements are finished, the following results will be displayed:
Center frequency
Lower corner frequency
Upper corner frequency
Q-Factor
In case the measurement fails a message box will display the reason for the failure. The measurement may sweep all frequencies successfully, but the maximum amplitude cannot be determined. In this case the error message “Could not find correct frequency responses and calculate Q-factor!” will be shown.
Select serial port connection in applications toolbar.
Connect the hardware to the host system and press the Start Q-Measurement button afterwards.
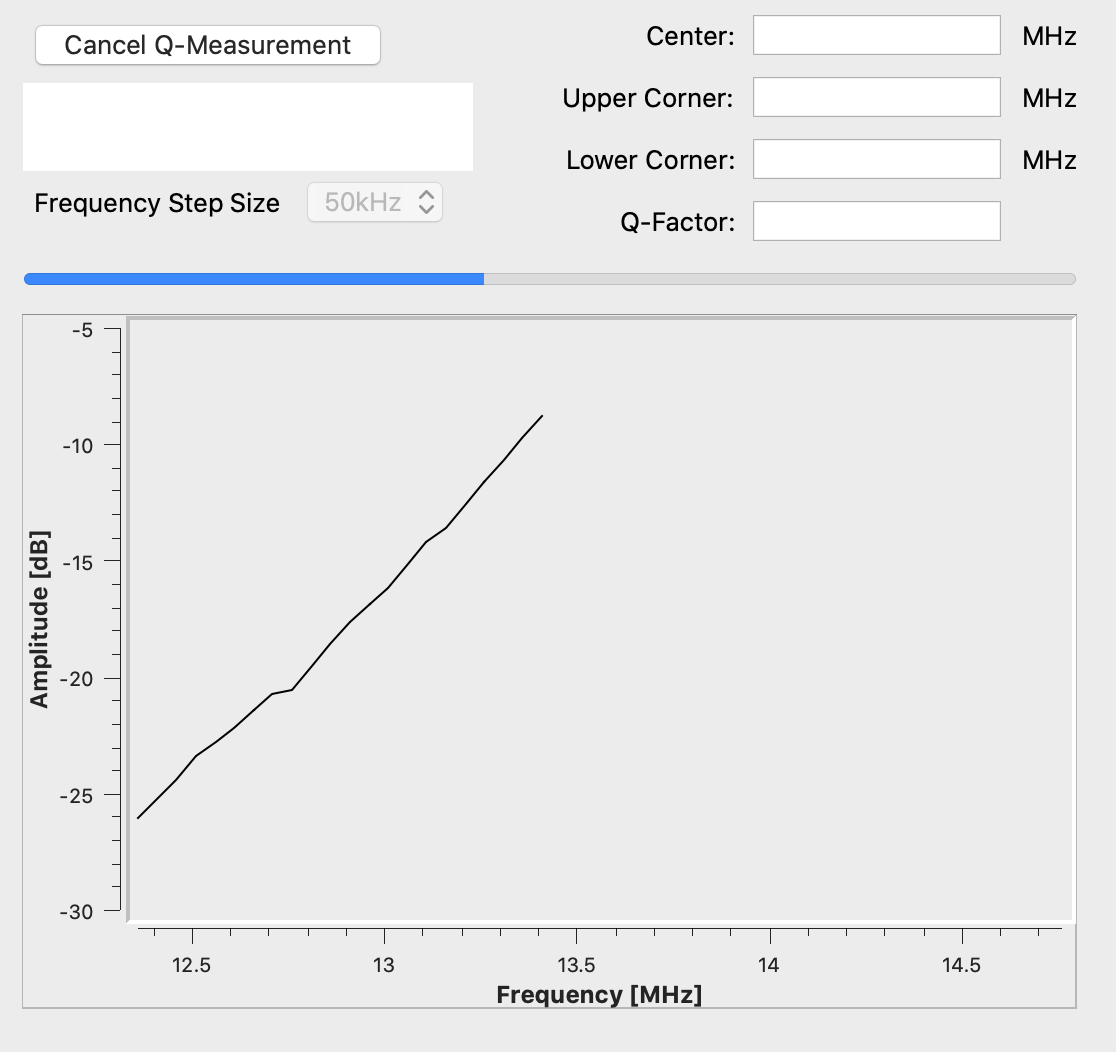
The Q-Measurement will start and display its current progress in a progress bar. During the measurement for every single frequency measured the plot in the bottom area of the Q-Measurement view will be updated. A running measurement can be aborted by pressing the Cancel Q-Measurement button.
Temperature Calibration application view
Under Modules select the Temperature Calibration entry. In the windowpane, a screen as shown in the figure below should appear.
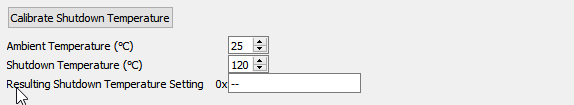
Shutdown temperature calibration is used to retrieve the chip shutdown temperature value used by NSC Stack. This value is a binary number for the chip only.
The Ambient Temperature and the Shutdown Temperature are the input parameters (in Celsius) to be adjusted according to user requirements. Start Temperature Calibration will start the process, which takes about a second to finish. If the Process has been completed successfully, the resulting chip-specific temperature value can be read out from the Resulting Shutdown Temperature Setting entry. This value may optionally be set in the user settings dialog to override the default configuration (E6).
Please note, changes in the default shutdown temperature settings will become effective after restarting the application
Test Signals and GPIOs application view
Under Modules select the Test Signals and GPIOs entry. In the windowpane, a screen as shown in the figure below should appear.
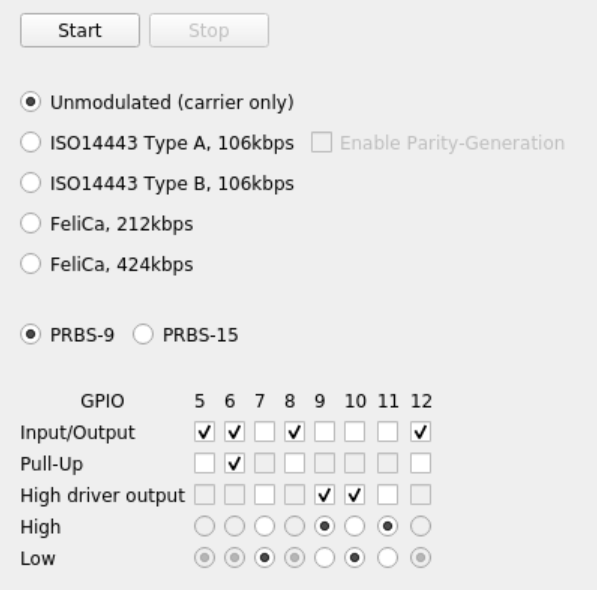
Test signals
Using this application one of the following test modes can be executed:
Unmodulated (carrier only) continuous transmission. (no PN needed)
ISO14443 Type A, 106kbps, continuous transmission of PN 9-stage (or PN 15-stage) standard coding test signal
ISO14443 Type B, 106kbps, continuous transmission of PN 9-stage (or PN 15-stage) standard coding test signal
FeliCa, 212kbps, continuous transmission of PN 9-stage (or PN 15-stage) standard coding test signal
FeliCa, 424kbps, continuous transmission of PN 9-stage (or PN 15-stage) standard coding test signal
The intended use of these test modes is to run VCCI conformity tests. The test patterns are implemented as specified in ITU.T O.150.
To initiate the transmission of a test pattern press the Start button. The test pattern will now be send continuously. To end the pattern transmission press the Stop button.
GPIOs
The lower area provides arbitrary configuration support for the GPIO pins. There are 8 pins (numbered 5-12), each of them can be configured separately according to the following table:
GPIO feature |
Description |
|---|---|
Input/Output |
Direction of the pin. Check means it is configured as input |
Pull-Up |
Internal pull-up can be enabled (only if the pin is set as input) |
High driver output |
Enable the high-current sink/source capability of the pin |
High |
Voltage on the pin represents logical ‘high’ |
Low |
Voltage on the pin represents logical ‘low’ |
Setting the direction of a pin to input will automatically disable output-related configurations (High current output, high/low setting) and the pin state will constantly be monitored and the High/Low radiobuttons will be updated accordingly. By default, all pins are configured as inputs without pull-ups enabled.
Setting a pin to output will automatically disable Pull-Up configuration and the pin will be updated instantly on changing the configuration or the output level in the window.
The functionality needs to be started with the Start button and may be stopped by pressing the Stop button.
License information
The End-User License Agreement (“EULA”) for this software is shown when running the installation of the software. Besides that the EULA can be found next to the application’s executables in the folder specified by the user when installing.
This software prominently states any usage of 3rd-party open source libraries in the application’s about box (Help | About).
This program uses Qt cross-platform application and UI framework licensed under LPGL. On each supported platform this program dynamically links to the Qt libraries which has been build from the unmodified Qt Source Code as provided by the Qt Company (git://code.qt.io/qt/qt5.git). Qt’s license provisions require to provide a written offer with instructions on how to get the source code. In case you have any trouble downloading the Qt Source Code from the official links provided above, makes hereby a written offer to provide such source code to you. To make a Qt source code request, send email to the following address: mailto:.
Qt’s license provisions require to notify about LGPL licensed software is used by this program. The full text of the LGPL licenses can be obtained from the application’s installation folder.
nlohmann_json
This software uses the nlohmann_json library licensed under the MIT License as listed below.
MIT License
Copyright (c) 2013-2022 Niels Lohmann
Permission is hereby granted, free of charge, to any person obtaining a copy of this software and associated documentation files (the “Software”), to deal in the Software without restriction, including without limitation the rights to use, copy, modify, merge, publish, distribute, sublicense, and/or sell copies of the Software, and to permit persons to whom the Software is furnished to do so, subject to the following conditions:
The above copyright notice and this permission notice shall be included in all copies or substantial portions of the Software.
THE SOFTWARE IS PROVIDED “AS IS”, WITHOUT WARRANTY OF ANY KIND, EXPRESS OR IMPLIED, INCLUDING BUT NOT LIMITED TO THE WARRANTIES OF MERCHANTABILITY, FITNESS FOR A PARTICULAR PURPOSE AND NONINFRINGEMENT. IN NO EVENT SHALL THE AUTHORS OR COPYRIGHT HOLDERS BE LIABLE FOR ANY CLAIM, DAMAGES OR OTHER LIABILITY, WHETHER IN AN ACTION OF CONTRACT, TORT OR OTHERWISE, ARISING FROM, OUT OF OR IN CONNECTION WITH THE SOFTWARE OR THE USE OR OTHER DEALINGS IN THE SOFTWARE.