5. Running The Demonstration Example
This section describes the steps required to prepare the Pro DevKit and other tools to successfully run the example code. A serial terminal, the SmartSnippets Toolbox (a tool delivered along with the SmartSnippets IDE), and the Command Line Interface (CLI) programmer are required for testing and verifying the code. If you are not familiar with the recommended process on how to clone a project or configure a serial terminal, read the Starting a Project tutorial.
There are two main methods to verify the correct behavior of the demonstrated code and inspect the contents of the flash memory. The first method is to use the SmartSnippets Toolbox and the second is to use the CLI programmer provided by the SDK. To facilitate the developer a third method, using a serial terminal, is also provided.
5.1. Verifying with a Serial Terminal
- Establish a connection between the target device and your PC through the USB2(DBG) port of the motherboard. This port is used both for powering and communicating with the DA1468x SoC. For this tutorial, a Pro DevKit is used.
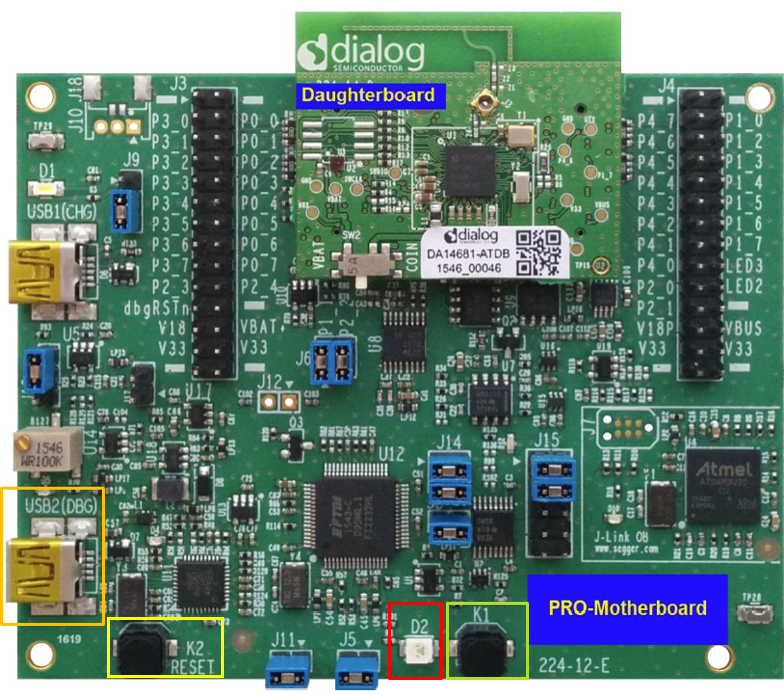
Fig. 19 DA1468x Pro DevKit
- Import and then make a copy of the freertos_retarget sample code found in the SDK of the DA1468x family of devices.
Note
It is essential to import the folder named scripts to perform various operations (including building, debugging, downloading).
- In the newly created project, add/modify the required code blocks as illustrated in the Code Overview section.
Note
It is possible for the defined macros not to be taken into consideration instantly. Hence, resulting in errors during compile time. If this is the case, the easiest way to deal with the issue is to: right-click on the application folder, select Index > Rebuild and then Index > Freshen All Files.
- Build the project in either Debug_QSPI or Release_QSPI mode and burn the generated image to the chip (either via the serial or jtag port).
- Press the K2 button on Pro DevKit to start the chip executing its firmware.
- Open a serial terminal (115200, 8-N-1) and press the K1 button on Pro DevKit. A debugging message is displayed on the console indicating the validation of the BD address stored in the flash memory. (1)
- Press the K1 button on Pro DevKit again. A new debugging message is displayed on the console indicating the invalidation of the BD address. (2)

Fig. 20 Debugging messages for NVMS Operations
5.2. Verifying with the SmartSnippets Toolbox
- With the system up and running, open the SmartSnippets Toolbox and execute the following steps:
- (Optional) Select New to create a new project (1). In the New Project window, enter a name for the project (2). This step is optional if a project has already been created.
- Choose an available project (4).
- Choose a communication interface (3) and a port (5).
- Select the family of devices to use (6).
- Open the selected project (7).
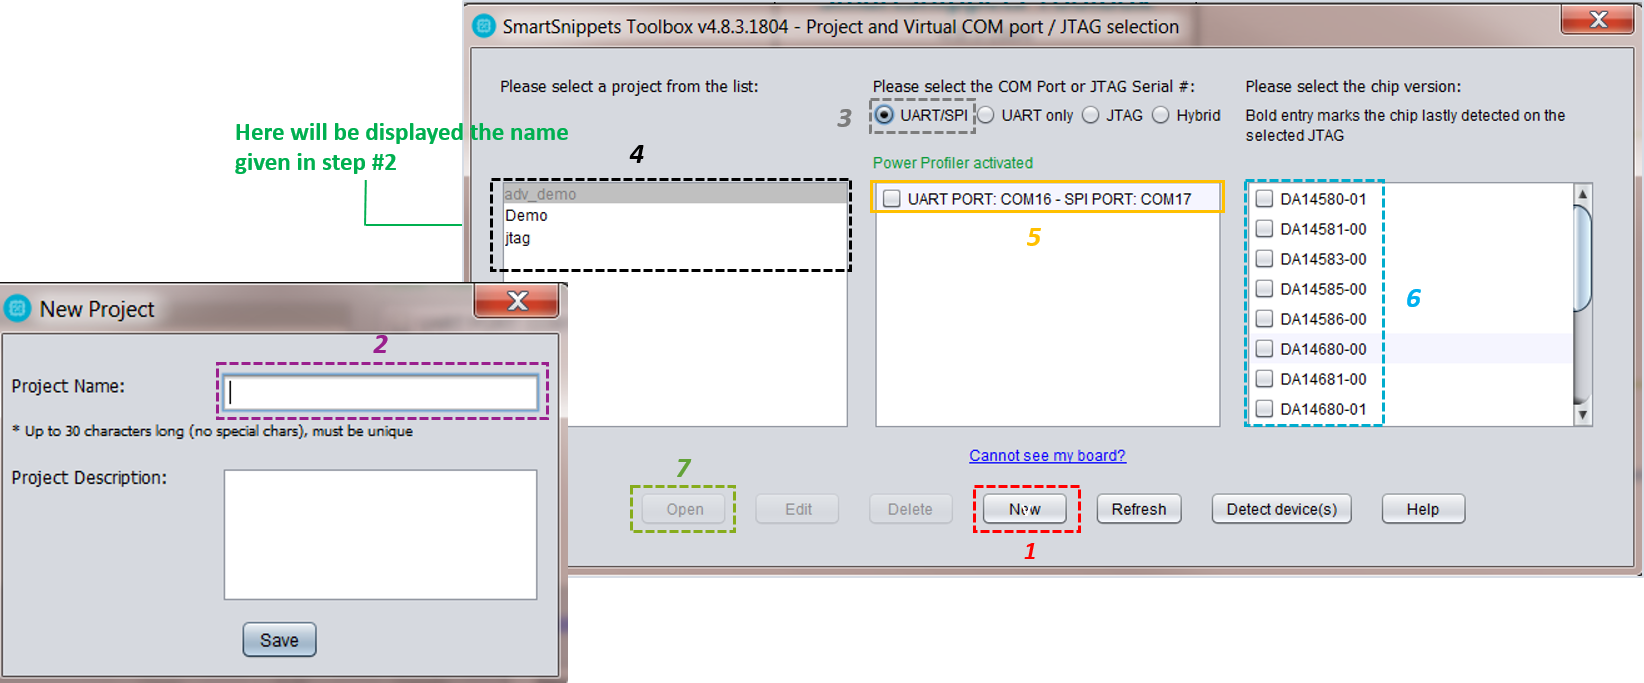
Fig. 21 Opening a Project in the SmartSnippets Toolbox
- Inspect the contents of the flash memory.
- Switch to the QSPI Partition Table window (1).

Fig. 22 SmartSnippets Toolbox - Display the Partition Table Area
- In the Partition Table area, click Connect (2). A rotating cursor is displayed waiting for the connected device to reset.
- Press button K2 on the DevKit to reset the device.
- Wait for the cursor to stop rotating and click Read (3). All the partition entries are displayed.
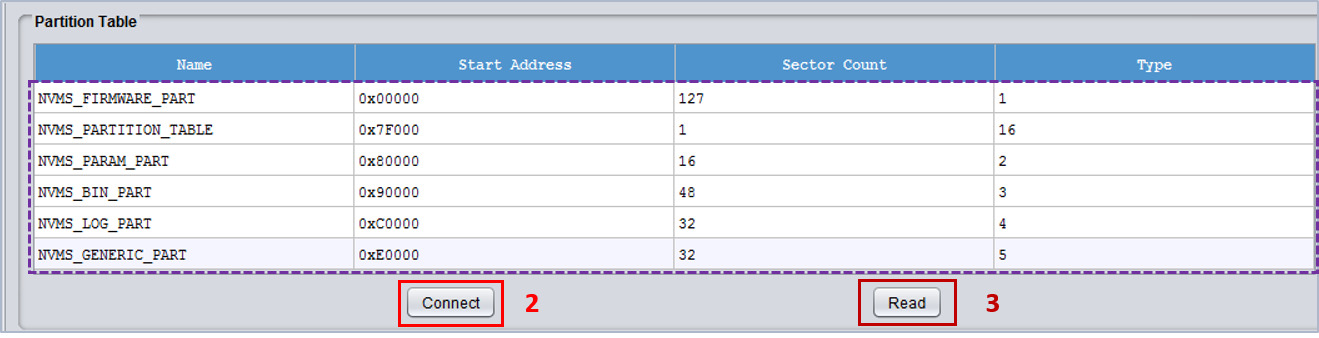
Fig. 23 SmartSnippets Toolbox, Partition Table Area
- In the Partition Tasks area, select the NVMS_LOG_PART partition entry (4).
- Press Read (5) and, after a while, the contents of the selected partition entry are displayed (6).
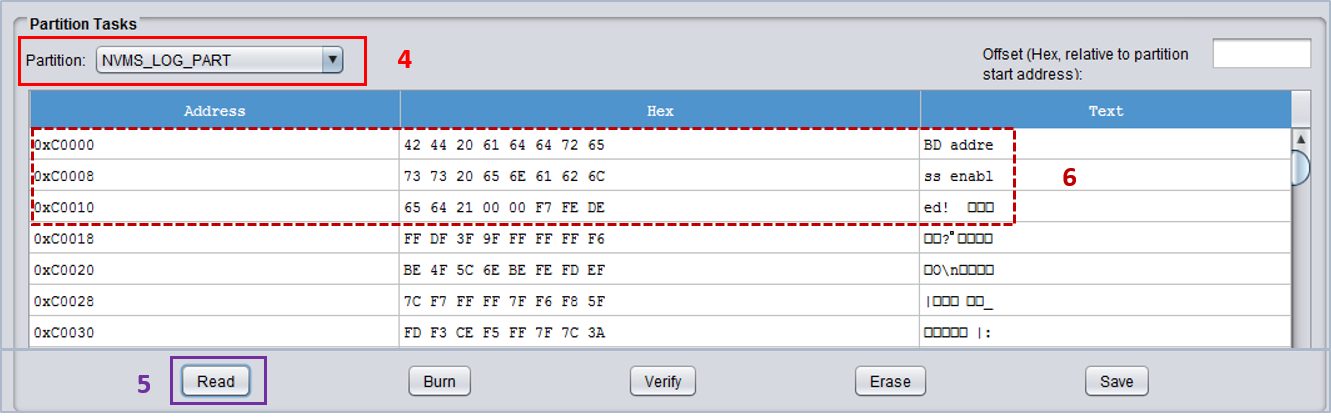
Fig. 24 SmartSnippets Toolbox, Partition Tasks Area
5.3. Verifying with the Command Line Interface (CLI) Programmer
The CLI programmer is a command line tool for reading/writing the flash/OTP/RAM. The tool communicates with the target device over a UART port or JTAG interface. This section demonstrates the JTAG interface. For more information on using the CLI programmer, please read the UM-B-044 User Manual: DA1468x Software Platform Reference (Appendix B).
- With the system up and running, start the gdbserver (J-link GDB Sever) using the configuration shown in Fig. 25.
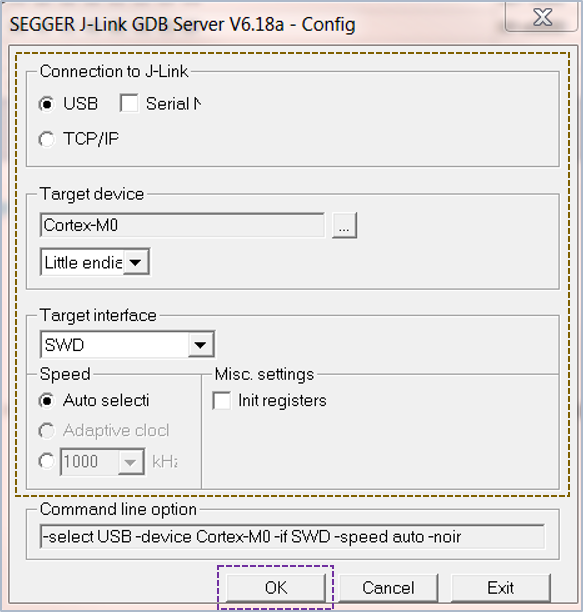
Fig. 25 Configuration of the GDB Server
Open a command prompt window (cmd) under the path where the CLI programmer is located. By default this is the
<sdk_root_directory>/binariesfolder of the SDK.Enter the command to read the flash memory over JTAG. The general form of this command is:
cli_programmer gdbserver read_qspi <address_in_flash> -- <number of bytes to read>For example, to read the first 25 bytes from the LOG partition entry (starting from the physical memory address 0xC0000), enter:
cli_programmer gdbserver read_qspi 0xC0000 -- 25
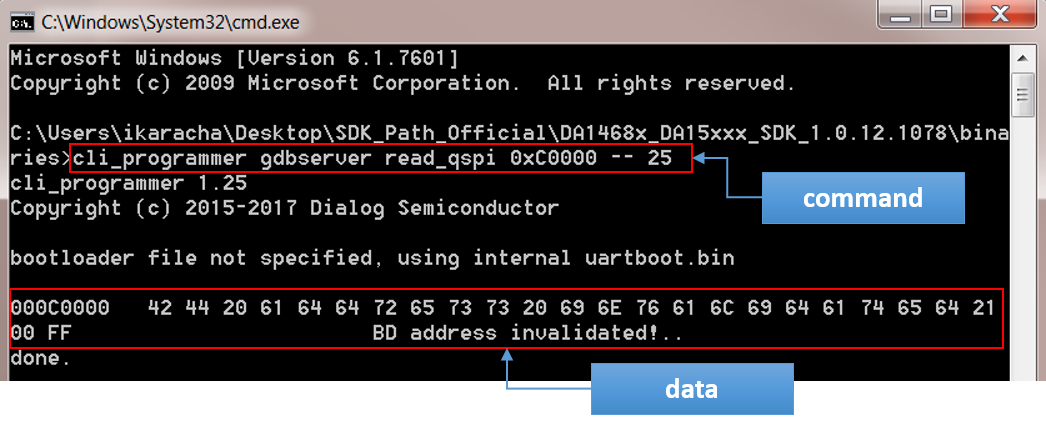
Fig. 26 Reading Flash Contents with the CLI Programmer