4. Hotplug (Attach) the GDB debugger
Hotplugging a GDB debugger refers to the ability to connect a GDB debugger to a running target system (such as a microcontroller or embedded system) without needing to reset or interrupt the system’s execution. Essentially, it means attaching the debugger to a system that is already powered on and actively running its code.
Hotplugging allows for attaching the debugger dynamically while the system is running, which can be particularly useful in certain real-time or embedded scenarios where you cannot afford to pause or restart the system.
Note
Since the DA1459x family of SOC’s will not go into sleep-mode when the debugger is connected, the only way to debug a system when sleep mode is enabled, is using hotplug (attach).
Hotplugging the GDB debugger has several advantages:
Non-Disruptive: Hotplugging allows you to attach a debugger to a running process without stopping or restarting it. This means you can investigate issues in real-time without interrupting the application’s workflow or causing downtime.
Real-Time Debugging: You can start debugging a system at the moment an issue occurs, rather than relying on logs or waiting for the problem to reproduce. This is particularly valuable for intermittent or hard-to-reproduce bugs.
Performance and Resource Efficiency: Since the system isn’t paused or restarted, you don’t lose any of the runtime context or state, which could otherwise be important for diagnosing the problem.
Avoiding Overhead from Debugging Tools: Some debuggers can introduce overhead when enabled. With hotplugging, you can avoid the constant overhead by only enabling the debugger when necessary, and disabling it afterward.
Better for Long-Running Systems: For systems that need to run continuously (like certain ble applications), hotplugging allows debugging without taking the system offline or losing important session data.
4.1. Adding the Hotplug launcher in e²studio
In order to use Hotplug debugging in e²studio a ‘Hotplug’ debug launcher needs to be added in the Debug Configuration section of e²studio.
Run the Debug Configurator by clicking Run->Debug Configurations:
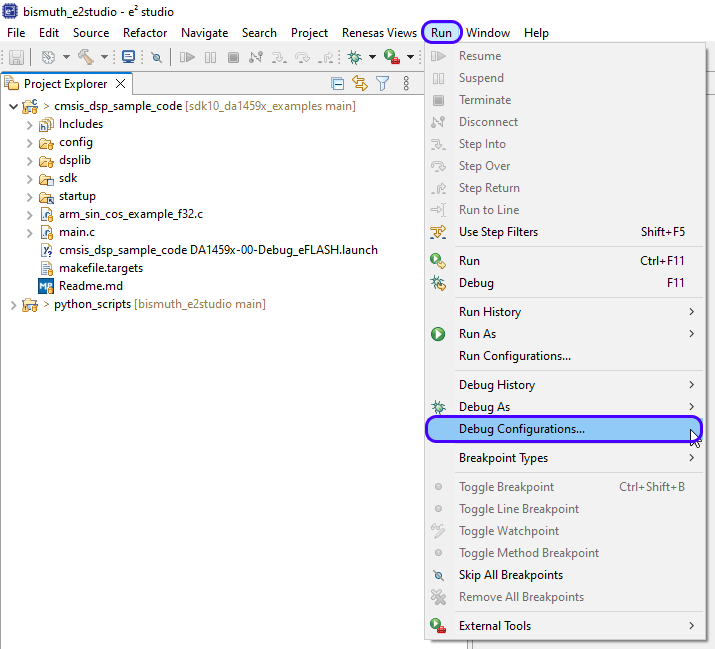
Figure 4 Start GDB debugger Configurator
Select the xxx DA1459X-00-Debug_eFLASH launcher in the Renesas GDB Hardware Debugging section and click Duplicate:
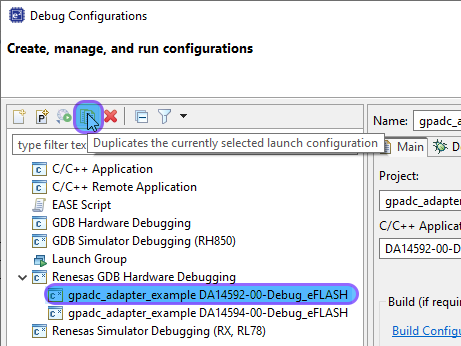
Figure 5 Duplicate xxx DA1459X-00-Debug_eFLASH launcher
The launcher, including all the settings, are duplicated and the name is extended with a number (1):
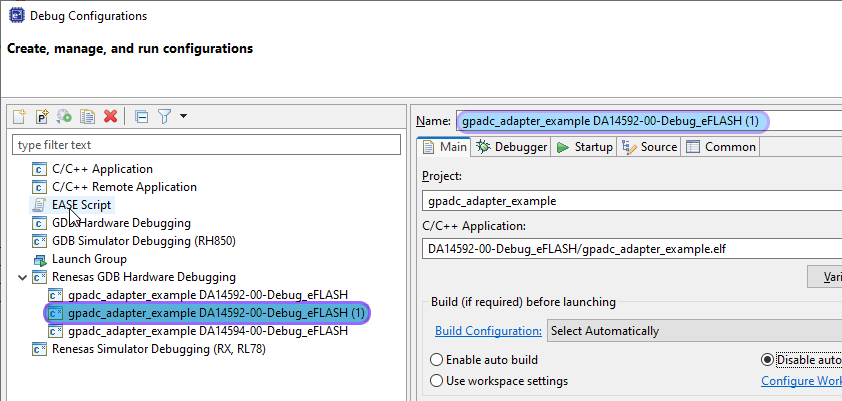
Figure 6 Duplicated xxx DA1459X-00-Debug_eFLASH launcher
Change the name to xxx DA1459x-00-Attach
Click on the Debugger tab and
Go to the Connection Settings
Set all the Reset related items to No
Remove the Script File (DA1459x.JLinkScript) (If this has been added in previous steps)
Set the Hotplug item to Yes
Click Apply
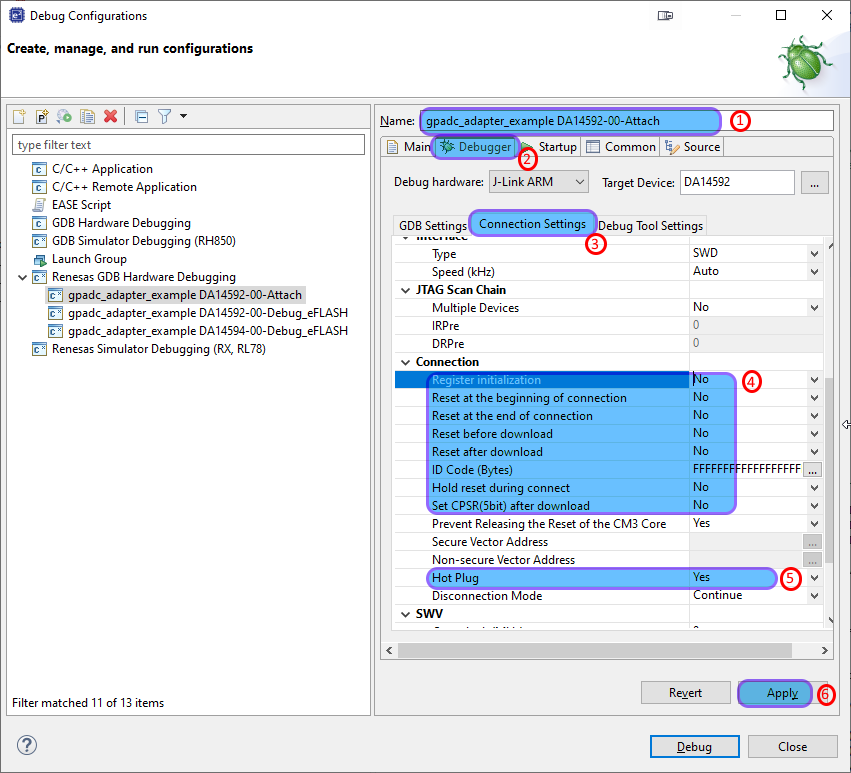
Figure 7 Connection Settings
Next click on the the Startup Tab
Set the Load type to Symbols only
Uncheck both Set breakpoint at: and Resume
Press Apply and
Start Debug
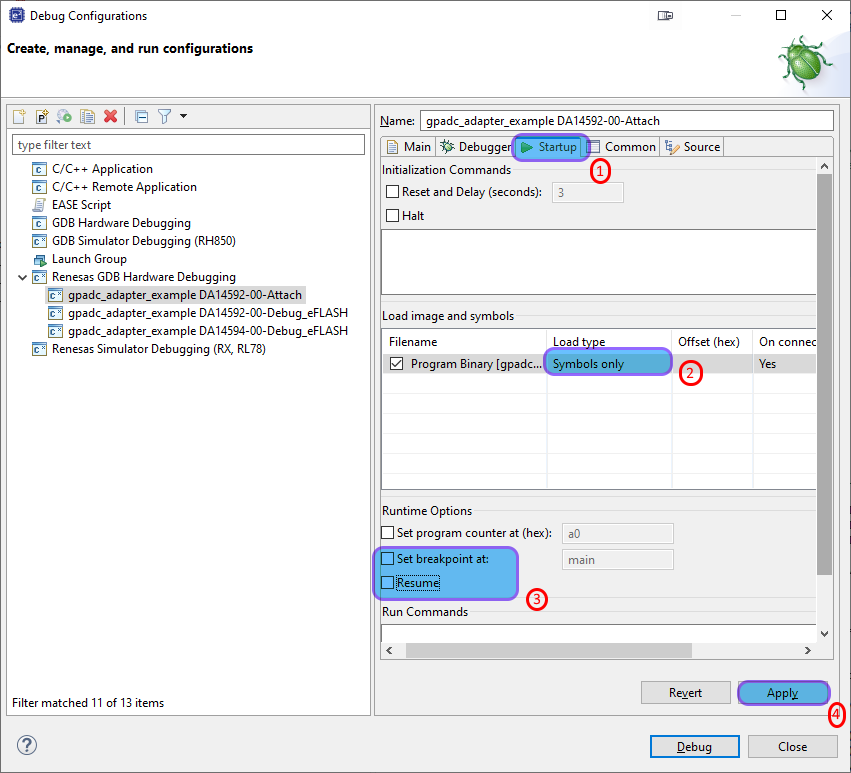
Figure 8 Startup Settings
If you follow the above steps carefully, the new Attach launcher should have been created and you can attach the GDB debugger to a running system without disturbing the running application.