3. Analyzing Hard-Fault
In this section we see to track a hard-fault in DA1453x,DA1458x project step by step.
3.1. Configuration
We have to connect User LED on jumper of development kits before we proceed. By default those jumpers are connected. Check on DA14585 Devkitp , DA14531 Devkitp or DA1453x Devkipt. You may need to review Devkitp Getting started guides for example here , please have a look at Getting Started with the Pro-Development Kits for User LED.
USB kit
On Renesas BLE USB kits User LED is connected to the chip directly.
Open
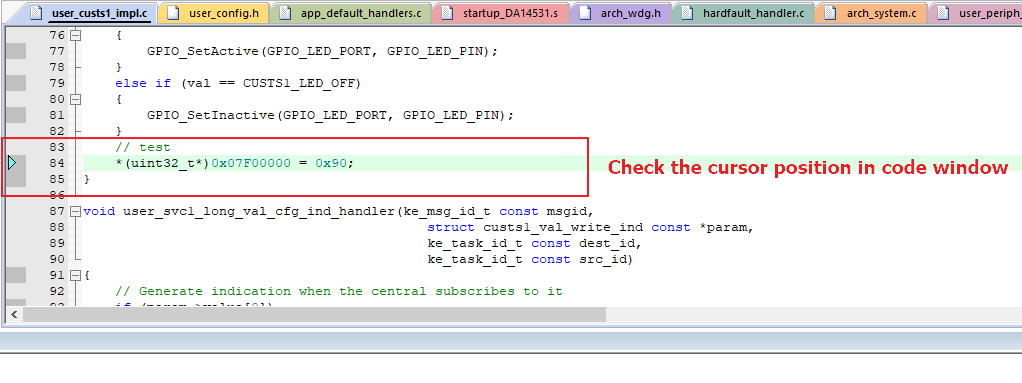
../target_apps/ble_examples/ble_app_peripheral/Keil_5/\ble_app_peripheral.uvprojxIn user_custs1_impl.c replace with the following code in function user_svc1_led_wr_ind_handler. Just after else if block finishes ,add:
*(uint32_t*)0x07F00000 = 0x90;
So the block code will look like:
void user_svc1_led_wr_ind_handler(ke_msg_id_t const msgid,
struct custs1_val_write_ind const *param,
ke_task_id_t const dest_id,
ke_task_id_t const src_id)
{
uint8_t val = 0;
memcpy(&val, ¶m->value[0], param->length);
if (val == CUSTS1_LED_ON)
{
GPIO_SetActive(GPIO_LED_PORT, GPIO_LED_PIN);
}
else if (val == CUSTS1_LED_OFF)
{
GPIO_SetInactive(GPIO_LED_PORT, GPIO_LED_PIN);
}
// test
*(uint32_t*)0x07F00000 = 0x90;
}
This line,purposefully creates a hard-fault which we aim to trap.
Build the project for your target (here Da14531).
After the code is successfully built, press on the Start/Stop Debugging button in Task Bar.

After the debugging session is started, press Run button to start the execution of code.

Open iOS Light-Blue - you will find your device is advertising.
Connect to your device using Light-Blue.
Find - LED State characteristics and press on it.
Find - write new value - and press on it.

Write 1 and press Done
You will see the Light-Blue shows disconnection alert message.

Go to Keil IDE you will see a hard-fault is trapped.

At this point there are 2 options to debug hard-fault:
- Option 1: When call stack is generated:
Open KEIL IDE call stack from:
[View->Call stack window]
Press right button mouse on HardFault_HandlerC and choose Show Caller Code option

You will see in disassembly window that where exactly the hardfault has occurred. You can see the hardfault in code window too.

- Option 2: When call stack is not generated
Open KEIL IDE call stack from
[View->Register window]
Open KEIL IDE call stack from
[View->Memory window->Memory 1]
In Registers window find out:
Stack pointer (SP) for this study the address is 07FC5400
Program counter (PC) for this study the address is 0x07FC0288
Main stack pointer (MSP) for this study the address is 0x07FC5400

Copy Main stack pointer (MSP) in this study the address is 0x07FC5400 Paste in Address of Memory 1 window. Then create the memory address as instructed below:
- In this study it is 0x07FC32A6

Right click on [Disassembly window] and Select [Show Disassembly at Address…]

Paste the address 0x07FC32A6 in [Show code at address window] and press [Go To] button.

Check the disassembly window.

Check the cursor position in [code window].